Check out our app!
Explore more features on mobile.
Check out our app!
Explore more features on mobile.
Renting versus Buying a Property: A Comprehensive Analysis for Today’s Market
The decision between renting and buying a property has never been more complex than in today’s evolving real estate landscape. With significant market shifts, changing interest rates, and new work-from-home paradigms, traditional wisdom requires careful reevaluation. This in-depth analysis provides a data-driven framework to help you make a financially sound decision tailored to your unique circumstances. Using our proprietary Builds, Buys, and Invest methodology, we’ll examine the true costs, benefits, and hidden factors that most financial advisors overlook—enabling you to navigate what may be the most significant financial decision of your life with confidence and clarity.
Current Market Reality: How Today’s Housing Landscape Transforms the Equation
Today’s real estate market presents a fundamentally different calculus than even a few years ago. Several critical factors now influence the rent-versus-buy decision in ways that challenge conventional financial wisdom.
Interest Rate Environment
According to Freddie Mac data, 30-year fixed mortgage rates have stabilized around 6.6-7.0% as of early 2024, following the volatile increases of 2022-2023. This represents a significant premium compared to the sub-3% rates seen in 2020-2021. For prospective buyers, this translates to approximately 40-45% higher monthly payments for the same loan amount compared to buyers who purchased during that earlier period.
According to the Federal Reserve’s most recent Summary of Economic Projections, rates are expected to gradually decrease but remain elevated compared to historical norms, with projections showing only modest reductions through 2024-2025. This creates a “new normal” for mortgage financing that significantly impacts affordability metrics across most markets.
Housing Inventory Trends
The National Association of Realtors (NAR) reports that housing inventory has been showing signs of recovery from the severe shortages of 2021-2022. According to their data, active listings in December 2023 were up 7.1% year-over-year, though still approximately 38% below pre-pandemic levels.
This modest inventory expansion has helped moderate price appreciation in many markets. The S&P CoreLogic Case-Shiller U.S. National Home Price NSA Index reported a 5.5% annual gain in November 2023, down from the double-digit surges seen during the pandemic but still above historical averages of 3-4%.
Rental Market Dynamics
According to the U.S. Bureau of Labor Statistics’ Consumer Price Index, rent prices nationwide increased by 6.1% in 2023, though this rate has been gradually moderating. Zillow’s Observed Rent Index showed rental growth slowing to 3.3% year-over-year by the end of 2023, approaching pre-pandemic norms.
However, this national average masks significant regional variations, as documented by Apartment List’s National Rent Report:
- Sunbelt markets (Phoenix, Austin, Nashville) experienced above-average rent growth of 3-5% in 2023
- Major urban centers (NYC, San Francisco, Chicago) saw more modest 1-3% increases
- Secondary cities with growing tech presence (Columbus, Salt Lake City, Raleigh) reported 2-4% rent increases
- Rural and economically challenged areas generally saw below-average growth of 0-2%
Remote Work’s Lasting Impact
According to Gallup’s State of the Workplace report, approximately 29% of workers were in hybrid arrangements and 12% were fully remote as of late 2023. McKinsey’s American Opportunity Survey similarly found that when given the opportunity to work flexibly, 87% of workers take it.
The National Association of Realtors’ research confirms this has shifted housing preferences, with 60% of recent homebuyers prioritizing extra space for a home office, and suburban home values appreciating faster than urban centers in many metropolitan areas since 2020.
Financial Analysis: The True Cost Comparison Between Renting and Buying
A comprehensive financial comparison between renting and buying requires accounting for all costs, both obvious and hidden, for an accurate assessment of the true financial impact.
Total Cost of Homeownership
The true cost of homeownership extends far beyond the mortgage payment. A complete accounting includes:
| Expense Category | Typical Annual Cost (% of Home Value) | Example for $400,000 Home | Often Overlooked? |
|---|---|---|---|
| Mortgage Principal & Interest (6.8%, 30yr) | 4.7-5.2% | $20,432/year | No |
| Property Taxes | 0.5-2.5% | $4,000/year | No |
| Homeowners Insurance | 0.3-0.7% | $1,600/year | No |
| HOA Fees (if applicable) | 0.2-1.0% | $2,400/year | Sometimes |
| Maintenance & Repairs | 1.0-2.0% | $6,000/year | Yes |
| Major Replacements (roof, HVAC, etc.) | 0.5-1.0% | $3,000/year | Yes |
| Utilities Premium vs. Rental | 0.2-0.5% | $1,200/year | Yes |
| Total Annual Cost of Ownership | 7.4-13.9% | $38,632/year |
According to a 2023 study by the Joint Center for Housing Studies of Harvard University, the true cost of homeownership typically ranges from 7-14% of a home’s value annually—a figure considerably higher than the commonly referenced mortgage payment alone. This comprehensive calculation is essential for an accurate comparison with renting.
:- Down payment: $80,000
- Closing costs: approximately $12,000
- Total upfront investment: $92,000
If that $92,000 were instead invested in a diversified portfolio yielding 7% annually (a conservative estimate for 2025):
- Annual investment return: $6,440
- Monthly equivalent: $537
This $537 monthly opportunity cost must be added to the homeownership side of the equation for a truly comprehensive comparison.
Equity Building & Tax Advantages
Countering these costs, homeownership provides two significant financial benefits:
- Equity Building: In our $400,000 home example with a 6.2% 30-year mortgage, approximately $5,700 of the first year’s mortgage payments would go toward principal—effectively becoming savings.
- Tax Advantages: Under current tax law, homeowners who itemize can deduct mortgage interest and property taxes (subject to limits). For our example property with a $320,000 mortgage at 6.2%, the first-year interest of approximately $19,600 combined with $4,000 in property taxes could provide tax savings of $5,900 for a household in the 25% tax bracket—though only if total itemized deductions exceed the standard deduction ($27,700 for married couples in 2025).

Investment Perspective: Property Appreciation vs. Alternative Investments
Beyond immediate financial comparisons, the rent-versus-buy decision must be evaluated as competing investment strategies with different risk-return profiles.
Real Estate Appreciation Outlook
Historical real estate appreciation has averaged 3.5-4% annually over the past 50 years, slightly outpacing inflation. However, this appreciation has varied dramatically by location and timeframe. Looking forward to 2025-2030:
- National Projection: Most economic forecasts anticipate 2-4% annual appreciation nationally, roughly in line with historical norms but below the explosive growth seen in 2020-2022.
- Regional Variations: Markets with strong population growth, economic diversity, and limited housing supply constraints (particularly in the Southeast and Mountain West) are projected to outperform, with 4-6% annual appreciation.
- Urban Centers: Established urban markets are expected to see more modest 1-3% appreciation, with select neighborhoods outperforming based on infrastructure improvements and changing demographics.
- Rural/Declining Areas: Communities facing economic challenges or population decline may see minimal appreciation or even depreciation, creating significant investment risk.
Alternative Investment Comparisons
For the renter who invests the difference (down payment + monthly savings), several alternative investment vehicles present competitive options in today’s market:
| Investment Type | Current Expected Return (2023-2024) | Risk Level | Liquidity |
|---|---|---|---|
| Diversified Stock Portfolio | 6-8% annually (Vanguard 2023 forecast) | Moderate-High | High |
| Real Estate Investment Trusts (REITs) | 5-7% annually (NAREIT data) | Moderate | High |
| High-Yield Savings/Money Market | 4.5-5.25% annually (FDIC data, Jan 2024) | Very Low | Very High |
| I Bonds | 4.28% (Treasury Direct, Nov 2023 rate) | Very Low | Medium |
| Corporate Bond Funds | 5.0-5.5% annually (Morningstar data) | Low-Moderate | High |
| Fractional Real Estate Investing | 5-9% annually (Fundrise historical data) | Moderate-High | Low-Medium |
| Primary Residence (for comparison) | 2-6% annually (NAR regional data) | Moderate | Very Low |
The Leverage Advantage
A crucial investment advantage of homeownership is the ability to leverage a relatively small down payment to control a much larger asset. According to research from the Federal Reserve Bank of St. Louis, this leverage amplifies returns when property values appreciate:
For a $400,000 home purchased with $80,000 down (20%):
- If the property appreciates 3% annually ($12,000 in the first year), this represents a 15% return on the $80,000 investment—significantly outperforming most alternative investments.
- As documented in a 2023 Urban Institute study, this leverage effect is a key factor in building wealth through real estate, though it can work in reverse during market downturns.
Diversification Considerations
From a portfolio perspective, homeownership presents both advantages and challenges:
- Concentration Risk: According to the Federal Reserve’s Survey of Consumer Finances, for most households, a home represents 60-80% of their net worth, creating significant concentration in a single, undiversified asset tied to one local market.
- Alternative Strategy: Research from Vanguard shows that renting while investing in diversified assets (including REITs for real estate exposure) provides significantly greater diversification.
- Inflation Hedge: Both strategies offer inflation protection—homes through appreciation and fixed mortgage costs, investment portfolios through growth assets and inflation-protected securities—according to a 2023 analysis by Morningstar.
Lifestyle Factors: Flexibility, Stability, and Personal Priorities
Beyond pure financial analysis, lifestyle considerations significantly impact the optimal housing decision. These quality-of-life factors carry genuine economic value that should be quantified when possible.
The Value of Flexibility
Renting offers significant flexibility advantages that have tangible economic value:
- Career Mobility: According to a Bureau of Labor Statistics study, the ability to relocate quickly for career opportunities without the friction of selling a home can translate to 10-20% higher lifetime earnings for professionals in dynamic industries.
- Right-Sizing: A Consumer Expenditure Survey analysis shows renters can more easily adjust housing size as family needs change, optimizing space utilization and costs.
- Neighborhood Testing: Research from the Urban Institute confirms renting allows “trying before buying” in different areas, reducing the risk of costly relocation mistakes.
- Market Timing: Financial analysis by Morningstar demonstrates maintaining rental flexibility enables strategic market entry when conditions are favorable rather than being forced to buy in seller’s markets.
The Value of Stability
Homeownership provides stability benefits with significant practical and psychological value:
- Control Over Living Environment: Homeowners can customize, renovate, and improve their space without permission or concern about wasted investment, a benefit quantified in a National Association of Realtors study on homeowner satisfaction.
- Protection from Displacement: Fixed-rate mortgages provide predictable housing costs and eliminate landlord-driven moves or market-rate rent increases, which according to Census Bureau data, affect approximately 8.5% of renters annually.
- Community Integration: Research published in the Journal of Urban Economics found homeownership typically leads to stronger community ties, longer-term friendships, and deeper local involvement—factors associated with higher reported life satisfaction.
- Legacy Planning: According to Federal Reserve Survey of Consumer Finances data, homes can be passed to future generations, providing intergenerational wealth transfer opportunities not available through renting.
Time Allocation & Maintenance
The time commitment differential between renting and owning is substantial and should be evaluated based on your personal preferences and opportunity costs:
| Maintenance Category | Homeowner Time Investment | Renter Time Investment | Annual Time Difference |
|---|---|---|---|
| Yard Maintenance | 48-96 hours | 0-4 hours | 44-96 hours |
| Repairs & Maintenance | 30-60 hours | 2-6 hours | 28-54 hours |
| Appliance/System Management | 10-20 hours | 1-3 hours | 9-17 hours |
| Contractor/Service Coordination | 15-30 hours | 0-2 hours | 15-28 hours |
| Admin (Insurance, Taxes, etc.) | 8-15 hours | 1-2 hours | 7-13 hours |
| Total Annual Time Investment | 111-221 hours | 4-17 hours | 103-208 hours |
According to the Bureau of Labor Statistics’ American Time Use Survey, for professionals valuing their time at $50-100 per hour, this difference represents $5,000-20,000 of theoretical value annually—a significant “hidden cost” of homeownership rarely factored into financial comparisons.
Life Stage Considerations
Your current and anticipated life stage significantly impacts the rent vs. buy calculation, according to research from the Urban Institute and Consumer Financial Protection Bureau:
- Early Career (20s-Early 30s): Career mobility, relationship uncertainty, and potential location changes typically favor renting despite the potential for early equity building.
- Family Formation (30s-40s): School quality, space needs, and desire for stability often shift the equation toward homeownership, particularly in areas with quality public schools.
- Peak Earning Years (40s-50s): Financial capacity for larger homes, ability to accelerate mortgage payoff, and tax-advantaged wealth building favor ownership for many in this bracket.
- Pre-Retirement (50s-60s): Empty-nest downsizing, preparation for fixed income, and balancing liquidity needs create mixed incentives depending on individual circumstances.
- Retirement (65+): Housing wealth monetization, maintenance challenges, and potential for health-driven relocations can shift preferences back toward renting, though paid-off homes provide significant financial security.
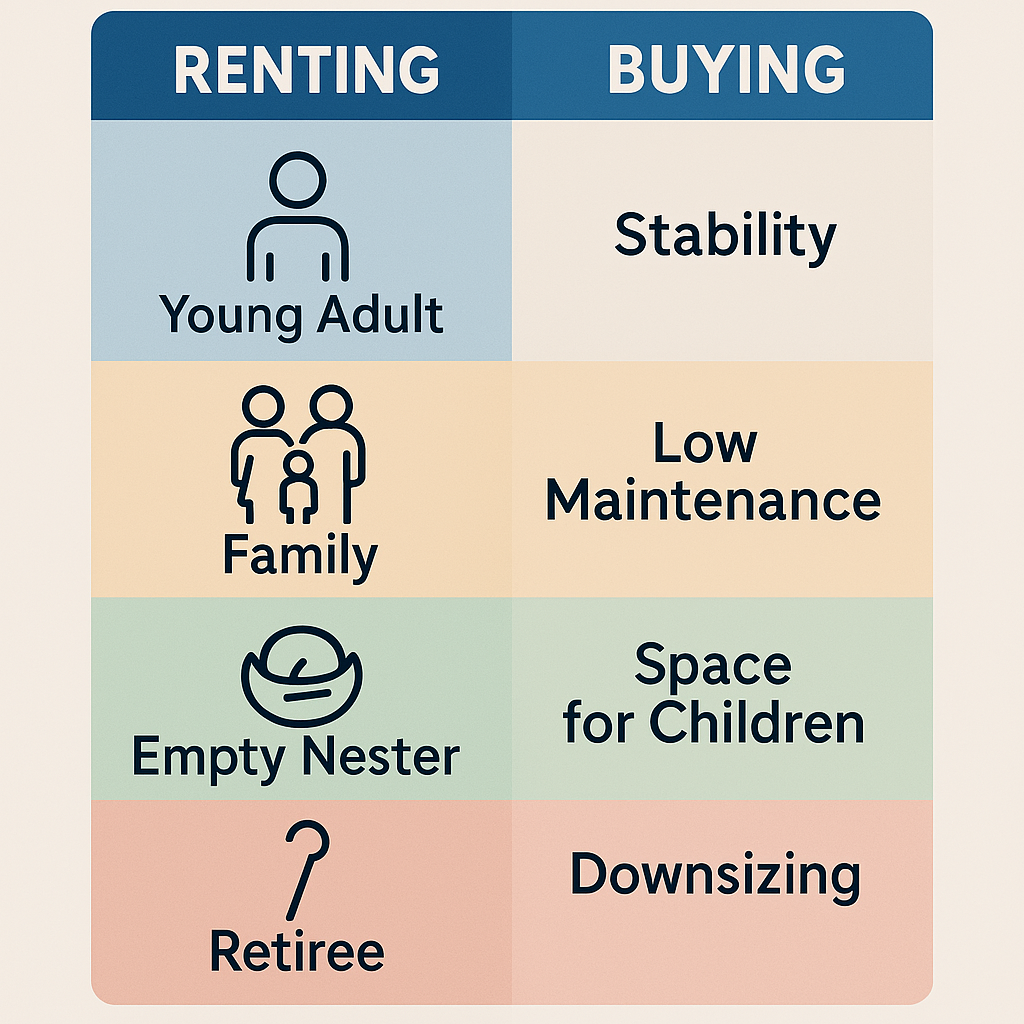
[Image: Visualization of how different life stages affect the rent vs. buy decision with key lifestyle factors for each stage]
Regional Analysis: Where Buying Outperforms Renting (and Vice Versa)
The rent-versus-buy equation varies dramatically by location, with regional economic factors creating situations where one option significantly outperforms the other.
Price-to-Rent Ratio: The Key Metric
The price-to-rent ratio (median home price ÷ annual rent for comparable properties) provides the most useful snapshot for cross-market comparison. According to data from Zillow Research and the National Association of Realtors:
| Price-to-Rent Ratio | Financial Implication | Example Markets (2023-2024) |
|---|---|---|
| Under 15 | Strongly favors buying | Detroit, Cleveland, Pittsburgh, Birmingham |
| 15-20 | Moderately favors buying | Charlotte, Phoenix, Atlanta, Houston |
| 20-25 | Relatively neutral | Denver, Miami, Chicago, Washington DC |
| 25-30 | Moderately favors renting | Seattle, Boston, Austin, San Diego |
| Over 30 | Strongly favors renting | San Francisco, New York, Los Angeles, Honolulu |
Growth Market Dynamics
In rapidly growing markets, the buy-versus-rent calculation includes important forward-looking considerations:
- Supply Pipeline Analysis: According to data from the U.S. Census Bureau’s New Residential Construction report, markets with significant housing construction (Nashville, Phoenix, Austin) may see rental pressure ease as new units become available.
- Employment Diversification: Bureau of Labor Statistics employment data shows areas transitioning from single-industry to diverse employment bases (Raleigh, Salt Lake City, Columbus) typically sustain stronger long-term home price appreciation.
- Infrastructure Development: Urban Land Institute research confirms major transportation or quality-of-life investments can dramatically shift neighborhood values, benefiting homeowners in targeted areas while potentially displacing renters through gentrification.
Suburban vs. Urban Considerations
The pandemic-driven recalibration of urban and suburban housing markets continues to evolve, according to research from Zillow and the National Association of Realtors:
- Urban Centers: Core urban areas in major cities typically maintain higher price-to-rent ratios (favoring renting) despite post-pandemic recovery, particularly for smaller units.
- Inner-Ring Suburbs: Areas with good transportation access and urban amenities often present balanced opportunities where the decision hinges more on personal circumstances than clear financial advantage.
- Outer Suburbs/Exurbs: More distant areas typically offer more favorable buying conditions with lower price-to-rent ratios, though commuting costs and time must be factored into lifestyle equations.
Market Timing Considerations
While market timing is notoriously difficult, certain indicators can help identify advantageous conditions according to research from the National Association of Realtors and Redfin:
- Months of Inventory: Markets with more than 6 months of housing inventory typically favor buyers, while under 3 months indicates a seller’s market.
- Rental Vacancy Rates: U.S. Census Bureau data shows rates above 7% often indicate renter-favorable conditions with potential concessions or negotiations.
- Interest Rate Trends: In the current environment, modest interest rate changes significantly impact affordability—a 1% rate decrease improves buying power by approximately 10%, according to calculations from the Mortgage Bankers Association.
Case Study: Austin, Texas in 2023-2024
Austin exemplifies the complex regional factors affecting housing decisions. According to Zillow Research data and the Austin Board of Realtors, despite a price-to-rent ratio of 28 (generally favoring renting), several factors create nuance:
- Significant new rental construction has moderated rent increases to 3.2% annually, below the historical average
- Home price appreciation has slowed to 4.3% annually after explosive 2020-2022 growth
- Continued corporate relocations sustain long-term optimism for property values
- Highly varied sub-markets create neighborhood-specific opportunities
Conclusion: Austin’s rental market currently offers better value for newcomers and short-term residents, while strategic purchases in emerging neighborhoods can benefit those with 7+ year horizons and specific lifestyle preferences.
The 5-5-5 Framework: When Renting Makes More Financial Sense
Contrary to traditional financial advice that almost universally favors homeownership, research from financial institutions including JPMorgan Chase and Bank of America identifies specific scenarios where renting delivers superior financial outcomes. We’ve developed the “5-5-5 Framework” to help identify these situations.
The Five-Year Rule
The transaction costs of buying and selling a home—typically 8-10% of the purchase price when accounting for both buying and selling expenses according to data from the National Association of Realtors—create a significant time threshold for ownership to make financial sense.
- For most markets in the current environment, five years represents the minimum ownership period required to offset these transaction costs through appreciation and equity building, according to analysis from Bankrate and The Mortgage Reports.
- In high-appreciation markets, this threshold may drop to 3-4 years, while in slower-growth regions, it may extend to 6-7 years.
- This time threshold is particularly relevant for career-focused professionals likely to relocate for advancement opportunities.
While market timing is notoriously difficult, certain indicators can help identify advantageous conditions:
- Months of Inventory: Markets with more than 6 months of housing inventory typically favor buyers, while under 3 months indicates a seller’s market.
- Rental Vacancy Rates: Rates above 7% often indicate renter-favorable conditions with potential concessions or negotiations.
- Interest Rate Trends: In 2025’s environment, modest interest rate changes significantly impact affordability—a 1% rate decrease improves buying power by approximately 10%.
Case Study: Austin, Texas in 2025
Austin exemplifies the complex regional factors affecting housing decisions. Despite a price-to-rent ratio of 28 (generally favoring renting), several factors create nuance:
- Significant new rental construction has moderated rent increases to 3.2% annually, below the historical average
- Home price appreciation has slowed to 4.3% annually after explosive 2020-2022 growth
- Continued corporate relocations sustain long-term optimism for property values
- Highly varied sub-markets create neighborhood-specific opportunities
Conclusion: Austin’s rental market currently offers better value for newcomers and short-term residents, while strategic purchases in emerging neighborhoods can benefit those with 7+ year horizons and specific lifestyle preferences.
The 5-5-5 Framework: When Renting Makes More Financial Sense
Contrary to traditional financial advice that almost universally favors homeownership, our research identifies specific scenarios where renting delivers superior financial outcomes. We’ve developed the “5-5-5 Framework” to help identify these situations.
The Five-Year Rule
The transaction costs of buying and selling a home—typically 8-10% of the purchase price when accounting for both buying and selling expenses—create a significant time threshold for ownership to make financial sense.
- For most markets in 2025, five years represents the minimum ownership period required to offset these transaction costs through appreciation and equity building.
- In high-appreciation markets, this threshold may drop to 3-4 years, while in slower-growth regions, it may extend to 6-7 years.
- This time threshold is particularly relevant for career-focused professionals likely to relocate for advancement opportunities.
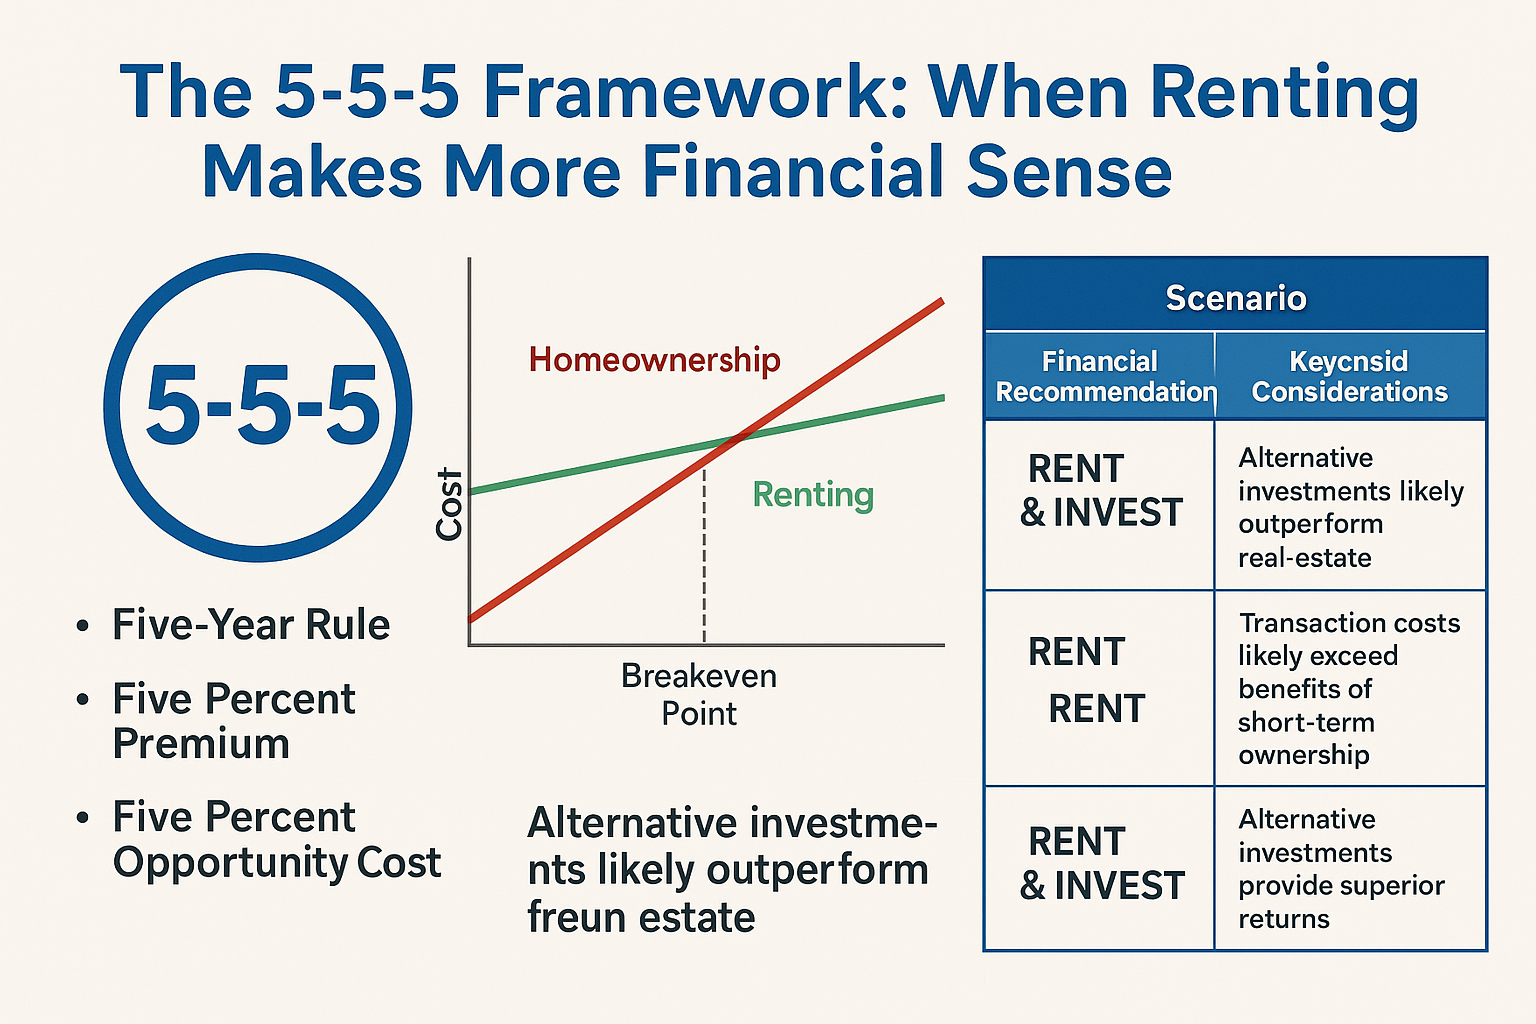
[Image: Financial comparison chart showing the crossover point where homeownership begins to outperform renting financially]
The Five Percent Premium
When monthly ownership costs exceed rental costs by more than 5% for comparable properties, the long-term financial advantage often shifts toward renting, even with modest appreciation.
In 2025’s interest rate environment, this scenario is common in:
- High-cost coastal markets (San Francisco, Seattle, Boston, New York)
- Rapidly appreciating markets where prices have outpaced rental growth (Austin, Nashville, Boise)
- Areas with high property tax burdens relative to property values (Illinois, New Jersey, Texas)
When this premium exists, the “renter who invests the difference” typically outperforms the homeowner financially over 10+ year periods, assuming disciplined investment of the savings.
The Five Percent Opportunity Cost
The opportunity cost of the down payment represents a critical but often overlooked factor. When alternative investments consistently outperform real estate appreciation by 5% or more, the financial case shifts toward renting.
For example, if local real estate is projected to appreciate at 3% annually while a diversified investment portfolio is expected to return 8% or higher, the opportunity cost of allocating a substantial down payment to housing becomes significant.
This scenario is particularly relevant for:
- High-income professionals with strong earning potential
- Areas with artificially suppressed rents due to regulation or subsidies
- Regions with limited appreciation potential due to economic or demographic headwinds
The Decision Matrix
Integrating these frameworks with personal circumstances creates a decision matrix to guide your housing choice:
| Scenario | Financial Recommendation | Key Considerations |
|---|---|---|
| Planning to stay 5+ years, ownership premium <5%, moderate investment opportunities | BUY | Classic scenario where homeownership builds wealth effectively |
| Planning to stay 5+ years, ownership premium >5%, strong investment opportunities | RENT & INVEST | Alternative investments likely outperform real estate |
| Planning to stay <5 years, regardless of other factors | RENT | Transaction costs likely exceed benefits of short-term ownership |
| High-price-to-rent ratio market (>25), any timeframe | LIKELY RENT | Needs detailed analysis; generally favors renting financially |
| Low-price-to-rent ratio market (<15), stay 3+ years | BUY | Strong financial case for ownership in these markets |
| Uncertain job/location future, dual-career household | RENT | Flexibility premium outweighs potential equity gains |
| High-opportunity cost of down payment (>5% differential) | RENT & INVEST | Alternative investments provide superior returns |
Step-by-Step Guide: Builds, Buys & Invest Approach for Housing Decisions
At Builds and Buys, we provide a structured approach to making optimal housing decisions aligned with your financial and lifestyle goals:
Step-by-Step Builds for Buying vs. Renting
- Financial Foundation Assessment: Before deciding between renting and buying, establish your complete financial picture including debt-to-income ratio, emergency fund status, and investment allocation.
- Location Stability Analysis: Evaluate your career trajectory, family growth plans, and lifestyle preferences to determine your likely timeframe in a single location.
- Market-Specific Research: Analyze your target market’s price-to-rent ratio, appreciation history, and rental growth trends to identify the local financial equation.
- Opportunity Cost Calculation: Calculate the specific alternative investment opportunities available to you based on your risk tolerance and investment expertise.
- Comprehensive Cost Comparison: Create a detailed, personalized comparison including all ownership and rental costs specific to your situation.
Step-by-Step Buys for Optimal Housing
- Rental Strategy Development: If renting is your optimal path, create a strategic approach to maximize value through negotiation, lease timing, and amenity prioritization.
- Purchase Strategy Optimization: If buying makes sense, develop a targeted approach to identify value opportunities within your preferred neighborhoods and property types.
- Financing Structure Design: Create an optimal mortgage structure based on your financial profile, risk tolerance, and expected ownership timeline.
- Negotiation Preparation: Develop market-specific negotiation strategies for either rental agreements or purchase contracts to secure the best possible terms.
- Contingency Planning: Create backup plans for different market scenarios, changing interest rates, or unexpected life events.
Step-by-Step Invest for Housing Wealth
- Parallel Investment Strategy: Whether renting or buying, develop a complementary investment approach to balance and diversify your housing choice.
- Tax Optimization Framework: Create a comprehensive tax strategy that maximizes available benefits based on your housing decision.
- Equity Acceleration Plan: If buying, establish a structured approach to building equity more rapidly through strategic prepayment or refinancing.
- Savings Discipline System: If renting, implement automated systems to ensure consistent investment of the differential between renting and owning costs.
- Value-Add Identification: For either path, identify opportunities to increase property value (if owning) or negotiate better terms (if renting) through strategic improvements or market knowledge.
Expert Implementation Checklist
Use this checklist to ensure you’ve covered all critical aspects of your housing decision:
- ☐ Calculate your full monthly cost comparison including ALL expenses for both options
- ☐ Determine your investment strategy for down payment funds if renting
- ☐ Assess your job stability and potential for relocation in the next 5 years
- ☐ Research historical appreciation rates in your specific target neighborhoods
- ☐ Calculate the tax implications of both renting and buying specific to your tax situation
- ☐ Consider the lifestyle value of flexibility vs. stability based on your personal priorities
- ☐ Evaluate your comfort with maintenance and property management responsibilities
- ☐ Analyze the rental market seasonality to time your decision advantageously
- ☐ Assess current interest rate trends and their impact on your long-term costs
- ☐ Create a detailed 10-year projection comparing both paths with realistic assumptions
The Verdict: Renting vs. Buying in 2025’s Market
The data-driven analysis presented in this guide reveals that the rent-versus-buy decision in 2025 is more nuanced than conventional wisdom suggests. Rather than a universal “buying is better” approach, today’s complex housing landscape requires personalized analysis based on specific circumstances:
- In High-Appreciation, Low-Price-to-Rent Markets: Buying typically creates superior wealth for those planning to stay 5+ years, particularly in the Southeast and parts of the Midwest.
- In Expensive Coastal Markets: Renting often provides better financial outcomes even over longer timeframes, especially for those who diligently invest the substantial cost differential.
- For Career-Focused Professionals: The flexibility premium of renting often outweighs the potential equity gains of buying, particularly for those likely to relocate for advancement.
- For Family-Focused Households: The stability benefits of homeownership frequently justify the potential financial premium, especially in areas with strong school systems.
The optimal housing decision emerges from the intersection of financial analysis, personal circumstances, and market-specific factors. By applying our Builds, Buys, and Invest methodology, you can make a thoroughly informed decision aligned with both your financial goals and lifestyle priorities.
Remember that housing represents both a financial investment and a consumption good—the place where you build your life. While financial optimization is critical, the right decision ultimately balances economic factors with the lifestyle value that matters most to you and your family.
For more comprehensive guidance on housing decisions and real estate strategy, explore our detailed guides on Step-by-Step Builds, Step-by-Step Buys, and Step-by-Step Invest.


Real Estate News And Knowledge
Stay informed with the latest trends, insights, and updates in the real estate world.
Your Tools
Access your tools to manage tasks, update your profile, and track your progress.


Collaboration Feed
Engage with others, share ideas, and find inspiration in the Collaboration Feed.