Check out our app!
Explore more features on mobile.
Are Solar Panels Worth It When Building a New Home? A Comprehensive Cost-Benefit Analysis
Installing solar panels during new home construction is a significant decision that impacts both your environmental footprint and financial future. This comprehensive analysis breaks down the true ROI of residential solar, examining upfront costs against long-term savings, current market incentives, and essential considerations that most homeowners overlook. Using our unique step-by-step approach for Builds, Buys, and Invest, we’ll help you determine if solar is a smart investment for your specific situation or simply an expensive addition with minimal returns.
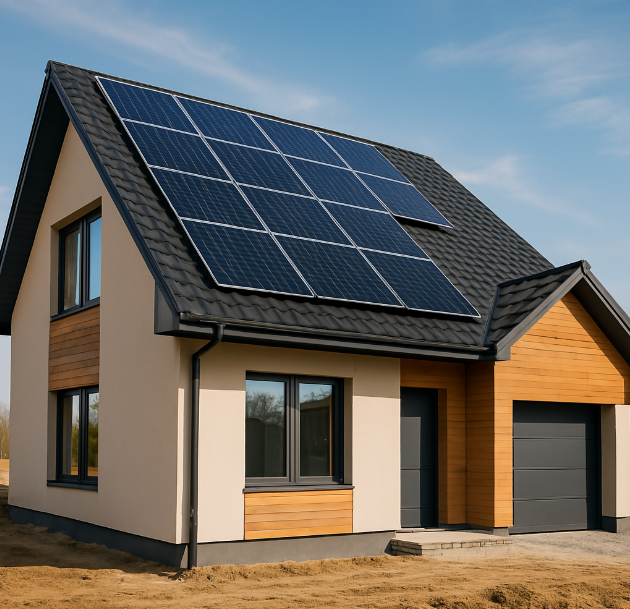
[Image: Solar panels integrated into new home construction design]
Solar Economics: Myth vs. Reality in 2025
The landscape of residential solar has transformed dramatically over the past decade. While solar panels were once viewed as an expensive eco-luxury, technological advances and market maturation have shifted the equation substantially. In 2025, the average cost of solar installation has decreased by 70% compared to 2010 prices, while efficiency ratings have increased by 20-30%.
However, the persistent myth that solar panels always deliver substantial savings requires critical examination. The reality is more nuanced—financial outcomes vary significantly based on location, electricity rates, sun exposure, and available incentives. In certain scenarios, particularly in states with high electricity costs and generous solar incentives like California, Massachusetts, and New Jersey, solar panels can indeed deliver substantial returns. In other regions with cheap electricity and minimal sun exposure, the financial case weakens considerably.
Market research indicates that 68% of new home solar installations in 2024 reached their break-even point within 8-12 years—a significant improvement from the 15-20 year payback periods common just five years ago. This data points to solar becoming a legitimate financial consideration rather than purely an environmental choice.
Complete Cost Analysis: Installation, Maintenance & Financing
To make an informed decision about solar panels for your new home, you need a comprehensive understanding of all associated costs—not just the upfront installation.
Initial Investment
For new construction in 2025, the average cost for a standard 6kW residential solar system ranges from $15,000 to $25,000 before incentives. This includes:
- Solar panels (typically 60-72 cell panels): $8,000-$12,000
- Inverter system: $1,500-$3,000
- Mounting hardware and integration with roof: $2,000-$4,000
- Electrical components and wiring: $1,000-$2,000
- Labor and permitting: $2,500-$4,000
When integrated during construction rather than retrofitted later, these costs can be 15-20% lower due to streamlined installation processes and potential bulk material savings through your builder.
Financing Considerations
Most homeowners finance solar installations through one of these methods:
| Financing Option | Typical Terms | Pros | Cons |
|---|---|---|---|
| Cash Purchase | One-time payment | Highest ROI, simplest ownership structure | Large upfront investment |
| Solar Loan | 10-20 years, 2.99-8.99% interest | Low/no down payment, you own the system | Interest reduces overall savings |
| Home Equity Loan/HELOC | 5-15 years, potentially tax-deductible interest | Lower interest rates than solar loans | Uses home as collateral |
| Mortgage Integration | Added to primary mortgage | Low interest, single payment | Extends debt period, slightly higher monthly payments |
| Power Purchase Agreement (PPA) | 20-25 year agreement, no ownership | No upfront cost, immediate savings | Lower overall savings, complicated home sale |
Long-Term Maintenance Costs
Solar systems require minimal but important maintenance to maintain efficiency:
- Panel cleaning: $150-$300 annually (can be DIY in many cases)
- Inverter replacement: $1,000-$2,500 (typically needed once during 25-30 year panel lifespan)
- System monitoring: $100-$200 annually (optional but recommended)
- Occasional repairs: $300 average per incident (rare but possible)
These ongoing costs reduce the total lifetime savings by approximately 5-10%, a factor often overlooked in basic ROI calculations.
Financial Benefits: Tax Incentives, Energy Savings & Property Value
Federal Tax Credits
The federal solar Investment Tax Credit (ITC) remains one of the most significant financial incentives for residential solar. For 2025, homeowners can claim 22% of their total solar system cost as a direct reduction in federal taxes owed. On a $20,000 system, this translates to $4,400 in tax savings, effectively reducing your net cost to $15,600.
It’s important to note that this credit requires having sufficient tax liability and cannot be carried forward indefinitely. Consult with a tax professional to ensure you can fully utilize this incentive.
State and Local Incentives
State and local incentives vary dramatically across the country but can substantially improve solar economics:
- State tax credits: 0-25% of system cost, depending on location
- Property tax exemptions: Many states exempt added home value from property tax calculations
- Performance-based incentives: Some utilities pay for each kWh your system generates
- Solar Renewable Energy Certificates (SRECs): Marketable certificates representing clean energy production
Energy Savings Analysis
The primary financial benefit comes from reduced electricity bills. The actual savings depend on:
- Local electricity rates (higher rates = greater savings)
- Solar production relative to home consumption
- Net metering policies in your area
- Future electricity rate increases (historically 2-5% annually)
In states with high electricity costs like California (average $0.30/kWh), a 6kW system producing 9,000 kWh annually could save approximately $2,700 per year. Conversely, in states with low electricity costs like Louisiana (average $0.11/kWh), the same system might only save $990 annually.
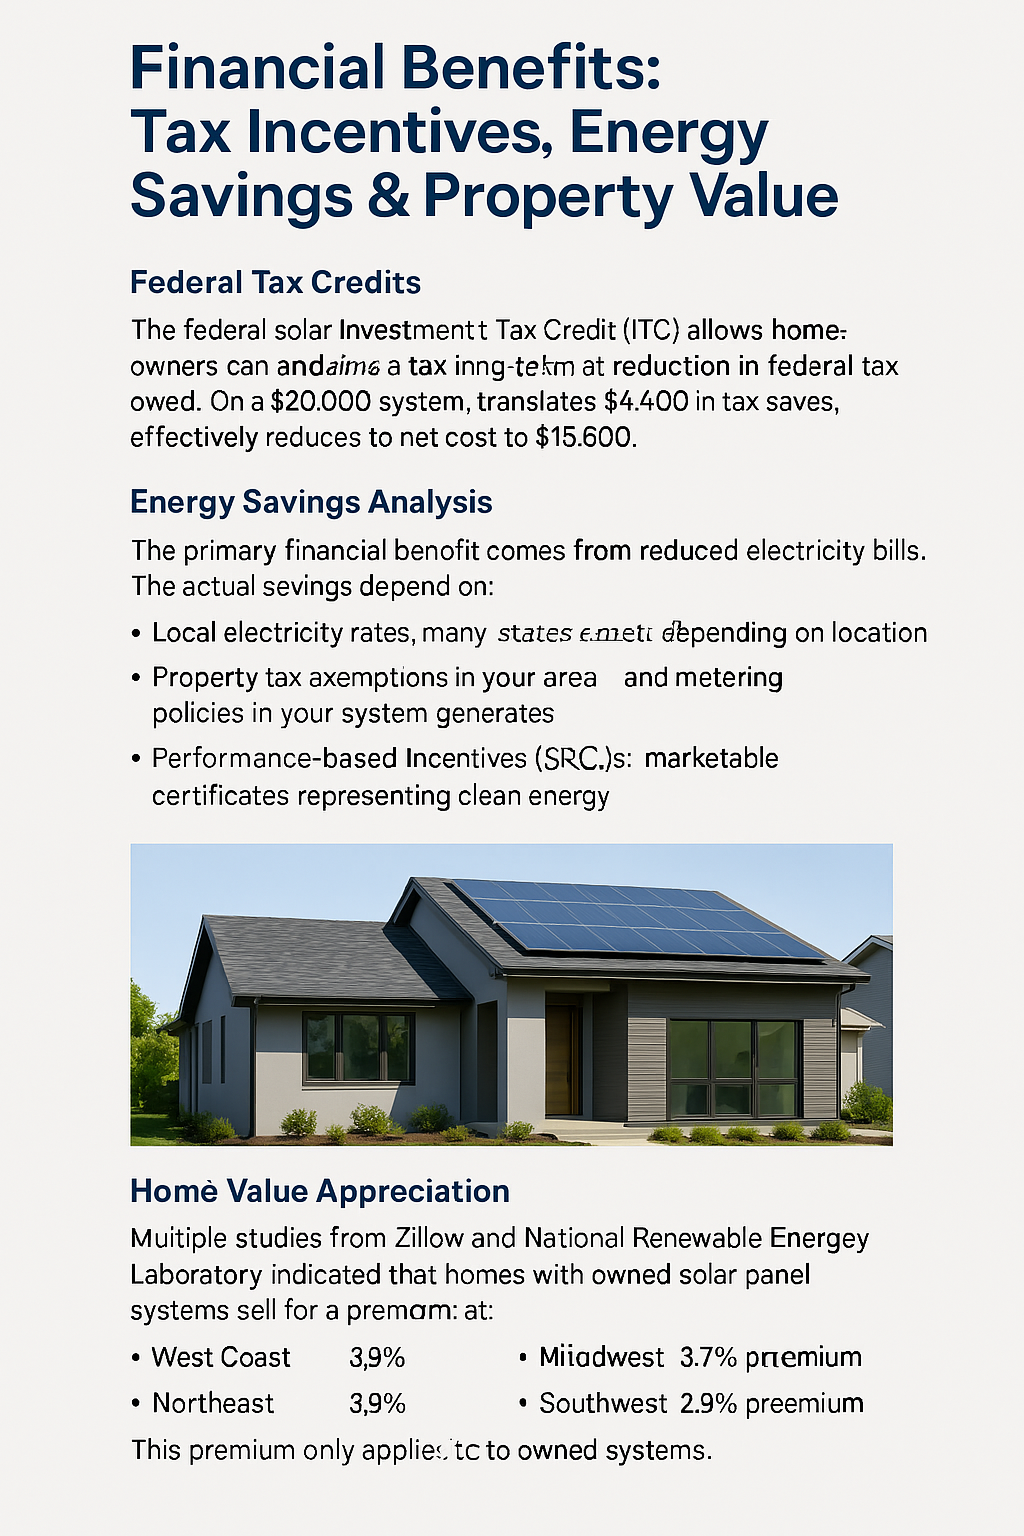
Home Value Appreciation
Multiple studies, including recent research from Zillow and the National Renewable Energy Laboratory, indicate that homes with owned solar panel systems sell for a premium. The average premium ranges from 3-4% of home value, with regional variations:
- West Coast: 4.1% average premium
- Northeast: 3.9% average premium
- Southwest: 3.7% average premium
- Midwest: 3.2% average premium
- Southeast: 2.9% average premium
On a $400,000 home, this represents a potential value increase of $11,600-$16,400, recovering a significant portion of the installation cost when you sell the home.
Importantly, this premium only applies to owned systems, not leased panels or those under PPAs, which can sometimes complicate home sales.
New Construction Advantage: Integration vs. Retrofitting
Installing solar panels during new home construction offers several distinct advantages over retrofitting an existing home, both financially and structurally:
Cost Efficiency
New construction solar integration typically costs 15-20% less than retrofitting for several reasons:
- Reduced labor costs (crews and equipment already on-site)
- No need to remove and replace existing roofing materials
- Simplified electrical integration with pre-construction planning
- Possible bulk material pricing through the builder
- Single permitting and inspection process
Structural Optimization
Building with solar in mind allows for structural optimizations that improve performance and aesthetics:
- Optimal roof orientation and pitch for solar production
- Built-in structural reinforcement for panel weight
- Clean, integrated electrical conduit design
- Option for solar roof tiles or building-integrated photovoltaics (BIPV) rather than traditional panels
- Dedicated electrical panel space and pre-installed solar-ready circuitry
Financing Benefits
Perhaps the most significant advantage comes from financing options available during new construction:
- Integration with primary mortgage, securing the lowest possible interest rates
- Extended repayment terms (30 years vs. 10-15 for typical solar loans)
- Potentially tax-deductible interest (consult your tax professional)
- Single monthly payment rather than separate solar financing
- Minimal impact on monthly cash flow due to extended term
When financed through a 30-year mortgage at current rates, a $20,000 solar system might add only $80-100 to your monthly payment while generating $150-250 in monthly electricity savings, creating immediate positive cash flow—a scenario rarely achievable with retrofit installations.
Regional Considerations: Where Solar Makes Financial Sense
The financial viability of solar panels varies dramatically by location due to several key factors. Understanding these regional variations is crucial to making an informed decision.
Solar Irradiance
Solar irradiance—the amount of sunlight available for energy production—varies significantly across regions:
- Southwest (AZ, NM, NV, CA): 5.5-6.5 kWh/m²/day average
- Southeast (FL, GA, SC): 5.0-5.5 kWh/m²/day average
- Midwest (IL, IN, OH): 4.0-4.5 kWh/m²/day average
- Northeast (NY, MA, CT): 3.5-4.0 kWh/m²/day average
- Pacific Northwest (WA, OR): 3.5-4.0 kWh/m²/day average
This variation means identical solar systems will produce 40-50% more electricity in Phoenix than in Seattle, significantly impacting ROI calculations.
Electricity Rates
Current residential electricity rates show dramatic regional differences:
| Region | Average Rate ($/kWh) | Annual Increase (5yr avg) | Solar Viability |
|---|---|---|---|
| Hawaii | $0.39 | 3.8% | Excellent |
| California | $0.30 | 5.2% | Excellent |
| Massachusetts | $0.27 | 4.1% | Very Good |
| New York | $0.24 | 3.5% | Good |
| Florida | $0.15 | 2.9% | Moderate |
| Texas | $0.14 | 2.7% | Moderate |
| Washington | $0.11 | 2.0% | Marginal |
| Louisiana | $0.11 | 1.8% | Marginal |
Local Incentives and Policies
Beyond electricity rates and sunlight, local policies significantly impact solar economics:
- Net Metering: Full retail-rate net metering (California, New Jersey) vs. avoided-cost rates (Alabama, Idaho) can create a 30-40% difference in lifetime savings
- State Tax Credits: Range from 0% (most states) to 25% (New York) of system cost
- Rebate Programs: Direct cash incentives available in select utility territories
- SREC Markets: Active in select states like New Jersey, Massachusetts, and Maryland, potentially generating $1,000+ annually
- Property Tax Exemptions: Available in 36 states, saving thousands over system lifetime
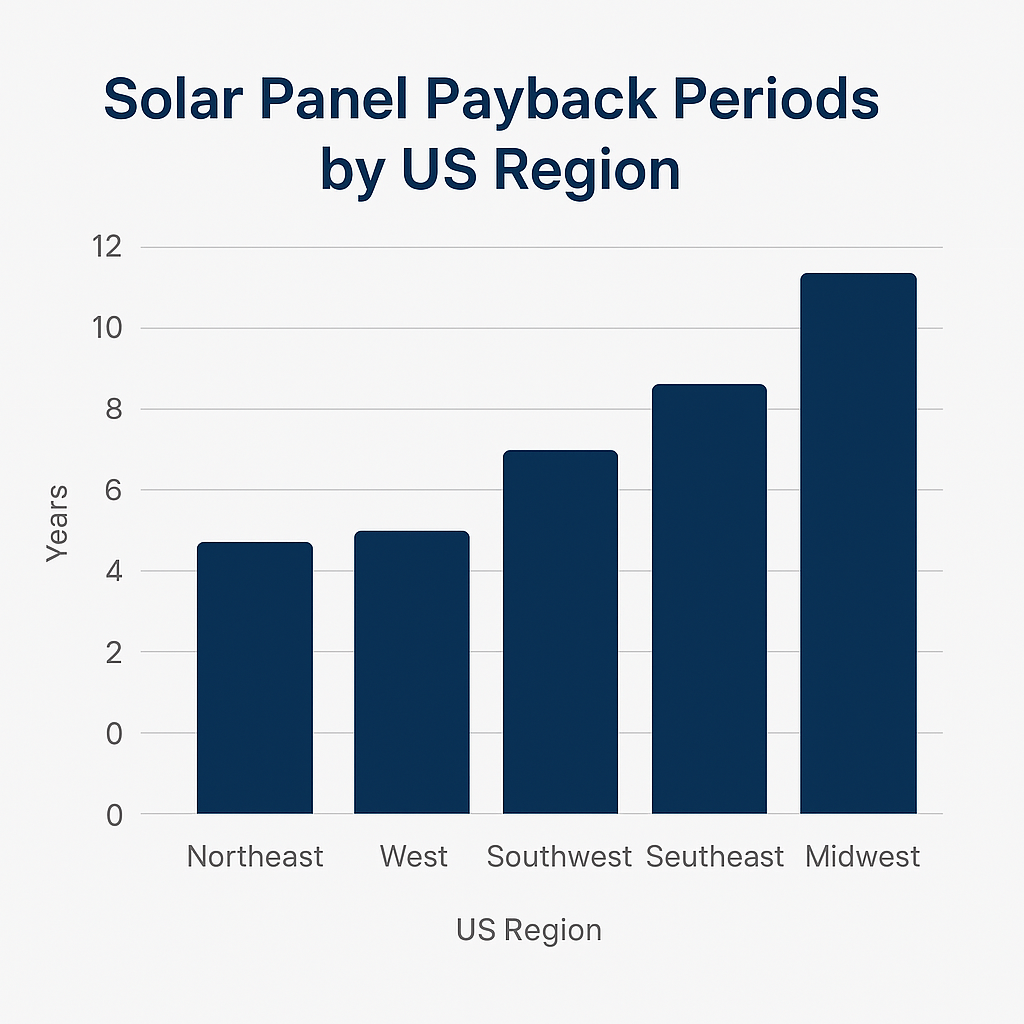
Regional ROI Comparison
When all factors are considered, the financial case for solar varies dramatically by region:
| Location | Payback Period | 20-Year ROI | Financial Verdict |
|---|---|---|---|
| San Diego, CA | 5-7 years | 250-300% | Excellent investment |
| Boston, MA | 6-8 years | 200-250% | Strong investment |
| Miami, FL | 9-11 years | 120-170% | Good investment |
| Dallas, TX | 11-13 years | 90-140% | Moderate investment |
| Seattle, WA | 15-17 years | 40-80% | Marginal investment |
| New Orleans, LA | 16-18 years | 30-70% | Questionable investment |
Payback Period Calculator: When Will You Break Even?
Understanding your specific break-even point is essential for making an informed solar decision. The formula for calculating your solar payback period includes numerous variables that must be personalized to your situation.
The Payback Period Formula
The basic formula for solar payback period is:
While this looks straightforward, accurately calculating each component requires careful consideration:
- Total System Cost: Installation cost plus financing expenses if applicable
- Incentives: Federal tax credits, state incentives, utility rebates, and other applicable programs
- Annual Financial Benefits: Electricity bill savings + SREC income + property tax savings + any additional benefits
For a more precise calculation, we need to account for:
- Annual solar panel degradation (typically 0.5% per year)
- Rising electricity costs (historical average of 2-5% annually)
- Maintenance costs over system lifetime
- Time value of money (discount rate)
Sample Calculation for New Construction
| Component | Example Values | Your Home (Fill In) |
|---|---|---|
| System Size | 6 kW | |
| Installation Cost | $18,000 | |
| Federal Tax Credit (22%) | -$3,960 | |
| State Incentives | -$1,500 | |
| Net System Cost | $12,540 | |
| Annual Electricity Production | 8,400 kWh | |
| Electricity Rate | $0.22/kWh | |
| Annual Electric Bill Savings | $1,848 | |
| Annual SREC Income | $300 | |
| Annual Maintenance Costs | -$150 | |
| Net Annual Benefit | $1,998 | |
| Simple Payback Period | 6.3 years |
This simplified example doesn’t account for panel degradation, rising electricity costs, or the time value of money. When these factors are included in a more sophisticated calculation:
- Rising electricity rates typically shorten the payback period by 0.5-1 year
- Panel degradation typically extends the payback period by 0.2-0.4 years
- Accounting for the time value of money typically extends the payback period by 0.5-1.5 years
Additional Factors to Consider
Beyond the pure financial calculation, several qualitative factors should influence your decision:
- Environmental Benefits: A typical home solar system offsets 100-150 tons of CO₂ over its lifetime
- Energy Independence: Protection from utility rate fluctuations and outages (with battery storage)
- Home Sale Timeline: If you plan to sell before reaching the payback period, consider the home value appreciation effect
- Future Technology: Solar equipment continues to improve and may offer upgrade opportunities
Step-by-Step Guide: Builds, Buys & Invest with Solar
At Builds and Buys, we provide a structured approach to incorporating solar into your real estate strategy:
Step-by-Step Builds with Solar
- Design Phase: Orient your home and roof to maximize solar exposure (south-facing with 15-40° pitch is ideal in North America)
- Pre-Construction Planning: Include solar-ready electrical systems and structural reinforcement in blueprints
- Builder Selection: Choose builders with solar integration experience or partnerships with solar installers
- Financing Integration: Incorporate solar costs into your construction loan or mortgage for optimal interest rates
- Construction Coordination: Ensure proper sequencing between roofing and solar installation
- Commissioning: Complete proper system testing, grid connection, and monitoring setup
Step-by-Step Buys with Solar
- Solar-Ready Home Identification: Target properties with optimal solar characteristics
- Solar Potential Assessment: Evaluate roof condition, orientation, and shading before purchase
- Existing System Evaluation: Professionally inspect any pre-installed solar systems before purchasing
- Ownership Verification: Confirm if existing systems are owned outright or under lease/PPA agreements
- Warranty Transfer: Ensure transferability of equipment warranties and installer guarantees
- Post-Purchase Optimization: Upgrade monitoring systems and maximize performance of existing installations
Step-by-Step Invest with Solar
- ROI Analysis: Calculate property-specific solar investment returns
- Tax Strategy Development: Maximize available incentives and depreciation benefits
- Financing Optimization: Structure solar investments for optimal return
- Property Value Impact: Leverage solar installations to increase property valuation
- Income Potential Exploration: Evaluate SREC markets and other solar income opportunities
- Exit Strategy Planning: Understand how solar impacts property marketing and sales timelines
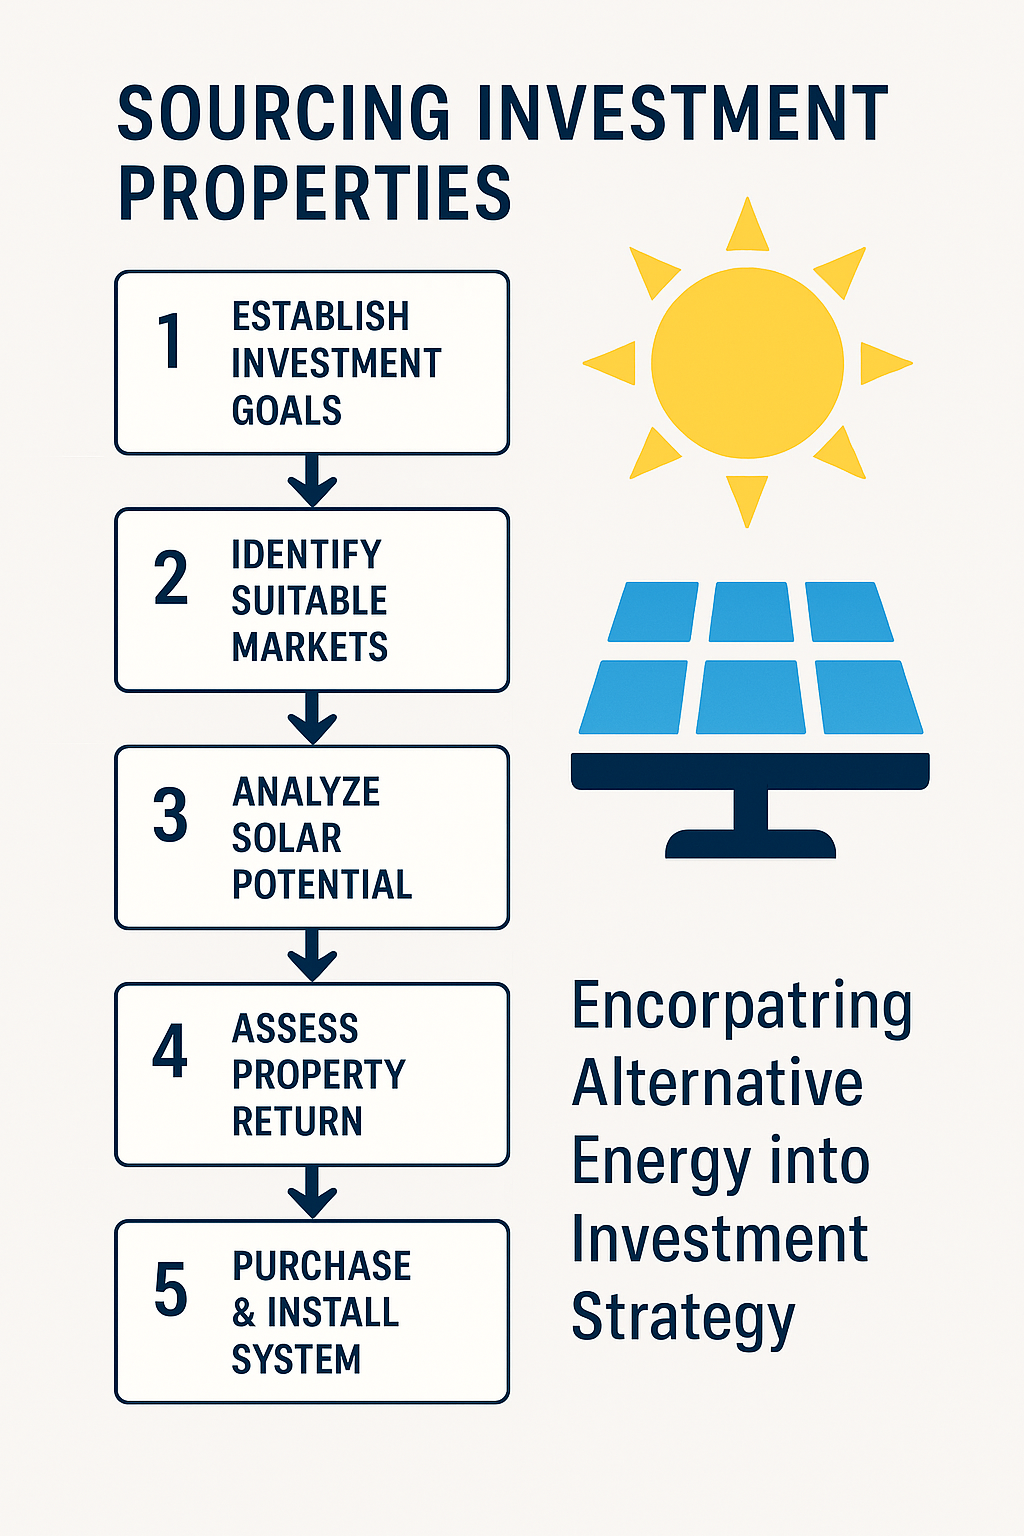
[Image: Solar investment strategy process diagram]
Expert Implementation Tips
To maximize your solar investment when building a new home:
- Request solar integration in your architectural plans from the beginning
- Compare multiple solar installer bids, not just the builder’s preferred vendor
- Consider slight increases in roof pitch or orientation adjustments if they significantly improve solar production
- Ensure your electrical panel has sufficient capacity for future expansion
- Pre-wire for battery storage even if not installing batteries initially
- Install consumption monitoring in addition to production monitoring
- Consider energy efficiency upgrades that complement solar (e.g., heat pumps, smart thermostats)
The Verdict: Are Solar Panels Worth It For New Construction?
Based on comprehensive financial analysis and regional considerations, we can draw several evidence-based conclusions about solar panel investments for new homes:
- In High-Value Markets (CA, MA, NJ, NY, HI): Solar panels are typically an excellent investment, with payback periods under 8 years and 20-year ROIs exceeding 200%.
- In Moderate Markets (CO, FL, TX, IL): Solar represents a reasonable investment with payback periods of 9-13 years and positive, though more modest, long-term returns.
- In Challenging Markets (WA, LA, WV): Solar may not make financial sense unless you highly value environmental benefits or energy independence.
For new construction specifically, the financial case strengthens substantially due to:
- 15-20% lower installation costs compared to retrofitting
- Optimal integration with home design for maximum performance
- Favorable financing through mortgage integration
- Immediate positive cash flow potential when financed appropriately
The solar investment myth reveals itself to be neither entirely true nor false—the answer depends heavily on your specific circumstances. By leveraging the analysis framework provided in this guide and our Builds and Buys step-by-step approach, you can make a data-driven decision about whether solar panels are the right investment for your new home.
For more actionable advice on solar and other home building investments, check out our comprehensive guides on Step-by-Step Builds, Step-by-Step Buys, and Step-by-Step Invest.


Real Estate News And Knowledge
Stay informed with the latest trends, insights, and updates in the real estate world.
Your Tools
Access your tools to manage tasks, update your profile, and track your progress.


Collaboration Feed
Engage with others, share ideas, and find inspiration in the Collaboration Feed.