Metro Vancouver Q1 2025 Real Estate: Comprehensive Data Overview
The Metro Vancouver housing market entered the first quarter of 2025 in a state of dynamic equilibrium, marked by resilient benchmark prices, surging inventory, and evolving policy pressures. After a gradual cooldown in mid‑2024, sales have rebounded toward decade‑long averages, while active listings climbed to levels unseen since early 2020. These shifts reflect both buyer caution amid higher borrowing costs and seller responsiveness to tax and regulatory changes.
In this section, we present a data‑rich breakdown of March 2025 market metrics—total residential sales, active listings, and MLS® Home Price Index values—alongside year‑over‑year and month‑over‑month comparisons. We also benchmark current performance against 10‑year seasonal averages to contextualize Metro Vancouver’s position within its broader market cycle. For detailed strategy and implementation checklists, explore our House Hacking guide and Flip ROI analysis.
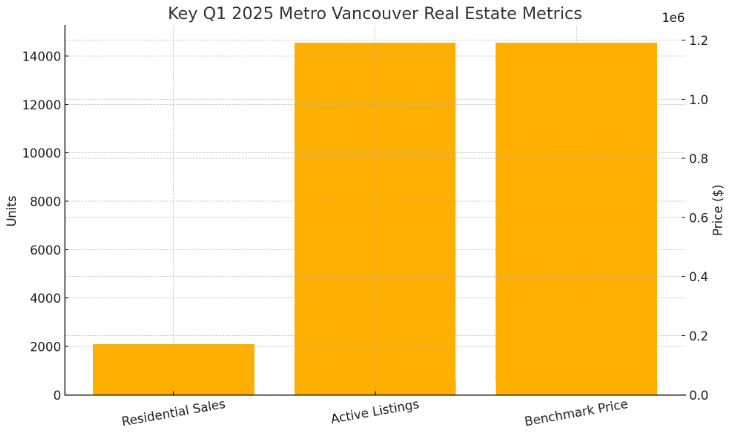
Key Q1 2025 metrics at a glance
Statistical Market Overview
According to the Greater Vancouver REALTORS® March 2025 Market Report, total residential sales reached 2,091 units, down 13.4% from 2,415 in March 2024 and 36.8% below the 10‑year seasonal average of 3,308 units. Active listings surged to 14,546, a 37.9% annual jump and 44.9% above the decade‐long norm, signaling a shift toward more balanced conditions.
The seasonally adjusted sales‑to‑active‑listings ratio—a key buyer vs. seller market gauge—averaged 14.4% in March 2025, down from 19.6% in March 2024 and below the 21–27% threshold that defines a seller’s market. At 14.4%, Metro Vancouver sits firmly in balanced territory, offering negotiating leverage for buyers without triggering widespread price declines.
The MLS® Home Price Index composite benchmark price for all residential properties was $1,190,900 in March 2025, a 0.6% decline from $1,198,300 a year earlier, yet a 0.5% increase from February 2025’s $1,184,500. This modest month‑over‑month uptick underscores persistent price resilience even as transaction volumes soften.
Property‑Type Breakdown
| Type | Benchmark Price | Y/Y Δ | M/M Δ | Sales / Listings |
|---|---|---|---|---|
| Detached | $2,034,400 | +0.8% | +0.4% | 10.3% |
| Attached | $1,113,100 | –0.8% | +0.2% | 21.5% |
| Apartment | $767,300 | –0.9% | +1.0% | 16.2% |
| Composite | $1,190,900 | –0.6% | +0.5% | 14.9% |
Source: Greater Vancouver REALTORS® March 2025 Market Report
Section 2: Submarket Deep‑Dive
Metro Vancouver’s vast geography encompasses submarkets with unique supply, demand, and price dynamics. Disaggregating performance by region reveals where opportunities lie:
Vancouver West
Known for its high‑end detached estates and ocean‑view condominiums, Vancouver West continues to command a premium. In March 2025:
- Detached benchmark: $3,451,900 (+1.3% Y/Y; +0.6% M/M)
- Attached (townhouse): $1,478,800 (+0.9% Y/Y; +0.4% M/M)
- Apartment: $1,265,800 (+0.5% Y/Y; +1.1% M/M)
- Sales-to-active listings: 9.8%, indicating strong seller resilience despite higher inventory.
High‑net‑worth buyers and international investors gravitate here for prestige and lower vacancy‑tax impact. See our Top 10 Real Estate Trends 2025 for more affluent‑market insights.
Eastside Corridor
Stretching from Kitsilano through Mount Pleasant to Commercial Drive, the Eastside blends older character homes with new condo developments:
- Kitsilano Detached: $2,125,000 (+0.4% Y/Y; –0.2% M/M)
- Mount Pleasant Apartment: $825,400 (–1.1% Y/Y; +0.9% M/M)
- Grandview‑Woodland Townhouse: $1,245,600 (+0.2% Y/Y; +0.3% M/M)
- Sales/Listings: 12.5%, reflecting balanced conditions with robust rental demand.
Young professionals and growing families favor the Eastside for walkability and amenity access. For first‑time buyer tactics in this zone, refer to our First Investment Real Estate Guide.
North Shore
Comprising North Vancouver and West Vancouver, the North Shore offers mountain‑view estates and purpose‑built rentals:
- West Vancouver Detached: $4,120,300 (+2.0% Y/Y; +0.8% M/M)
- North Vancouver Apartment: $1,150,400 (–0.7% Y/Y; +1.3% M/M)
- Adult Family Rentals (CMHC): $1,250 avg. monthly rent, yielding ~3.3% gross over apartment price
- Sales/Listings: 11.1%, indicating mild buyer’s market in apartments and balanced for houses.
Investors targeting stable rental yields should consider the North Shore’s purpose‑built sector. Our analysis of adjacent investments covers multi‑family yields in depth.
Neighbourhood Price Snapshot
| Area | Type | Benchmark Price | Y/Y Δ | Sales/Listings |
|---|---|---|---|---|
| Vancouver West | Detached | $3,451,900 | +1.3% | 9.8% |
| Kitsilano | Detached | $2,125,000 | +0.4% | 12.5% |
| Mount Pleasant | Apartment | $825,400 | –1.1% | 12.5% |
| West Vancouver | Detached | $4,120,300 | +2.0% | 11.1% |
Sources: LiveInCentralCity.ca; WOWA.ca; Greater Vancouver REALTORS®

Interactive submarket map (placeholder)
Section 3: Policy & Tax Updates
A suite of provincial and federal measures continues to reshape Metro Vancouver’s real estate landscape. In Q1 2025, residential property owners and investors must navigate the Speculation & Vacancy Tax (SVT), Vancouver’s Empty Homes Tax (EHT), and the federally mandated Foreign Buyer Ban—each carrying unique compliance requirements and market impacts.
Speculation & Vacancy Tax (SVT)
The SVT applies to residential properties in 19 B.C. communities, including all Metro Vancouver municipalities. It’s levied annually on the assessed value of properties not occupied by the owner or rented for at least six months. In 2025, the SVT rate remains:
- Canadian citizens/permanent residents: 0.5% of assessed value
- Foreign owners and satellite-family members: 2% of assessed value
Residential owners must declare online once they receive a letter from the Province, using their Letter ID and Declaration Code. Exemptions include principal residences, long‑term rentals, and properties subject to certain life‑lease agreements.
By expanding to 13 new communities effective January 1, 2024, and requiring first‑time declarations in January 2025, the SVT aims to unlock vacated homes into the rental market. Early reports indicate a 5% uptick in long‑term rental listings within taxable zones post‑2024 declarations.
Empty Homes Tax (EHT)
Vancouver’s EHT targets unoccupied residential properties within city limits, imposing a 3% levy on assessed value if no declaration or exemption applies. The program’s goals are to increase rental supply and deter speculative holding.
- Vacancy reference period: Jan 1–Dec 31, 2024
- Declaration deadline: Feb 4, 2025
- Tax rate: 3% of 2024 assessed value
- Penalties: Late declarations incur additional 10% surcharge on the tax amount
In Vancouver’s 2024 filing, 75% of properties declared occupancy or secured exemptions, while the remainder faced the 3% charge. Observers credit the EHT with converting over 1,200 vacant units into the long‑term rental pool by mid‑2025.
Foreign Buyer Ban
The Prohibition on the Purchase of Residential Property by Non‑Canadians Act bans non‑Canadian individuals and corporations from acquiring residential properties in Canadian CMAs and CAs. Initially effective Jan 1, 2023, the ban was extended on Feb 4, 2024 to remain in force through Jan 1, 2027. Core provisions include:
- Scope: Residential buildings of three units or fewer in CMAs/CAs
- Effective dates: Jan 1, 2023 – Jan 1, 2027
- Exceptions: Non‑Canadians purchasing with Canadian spouse/common‑law partner; rental agreements; pre‑Jan 1, 2023 binding offers
- Penalties: Fines up to $10,000 and possible forced sale orders
Critics argue the ban yields limited supply relief—foreign buyers accounted for only ~1% of transactions—but it underscores government resolve to prioritize domestic affordability.
Key Dates Checklist
- ☐ Jan 20, 2025 – SVT declaration period opens
- ☐ Feb 4, 2025 – EHT declaration deadline
- ☐ Mar 31, 2025 – SVT declaration deadline
- ☐ Jul 2, 2025 – SVT payment due
- ☐ Jan 1, 2027 – Foreign Buyer Ban expires
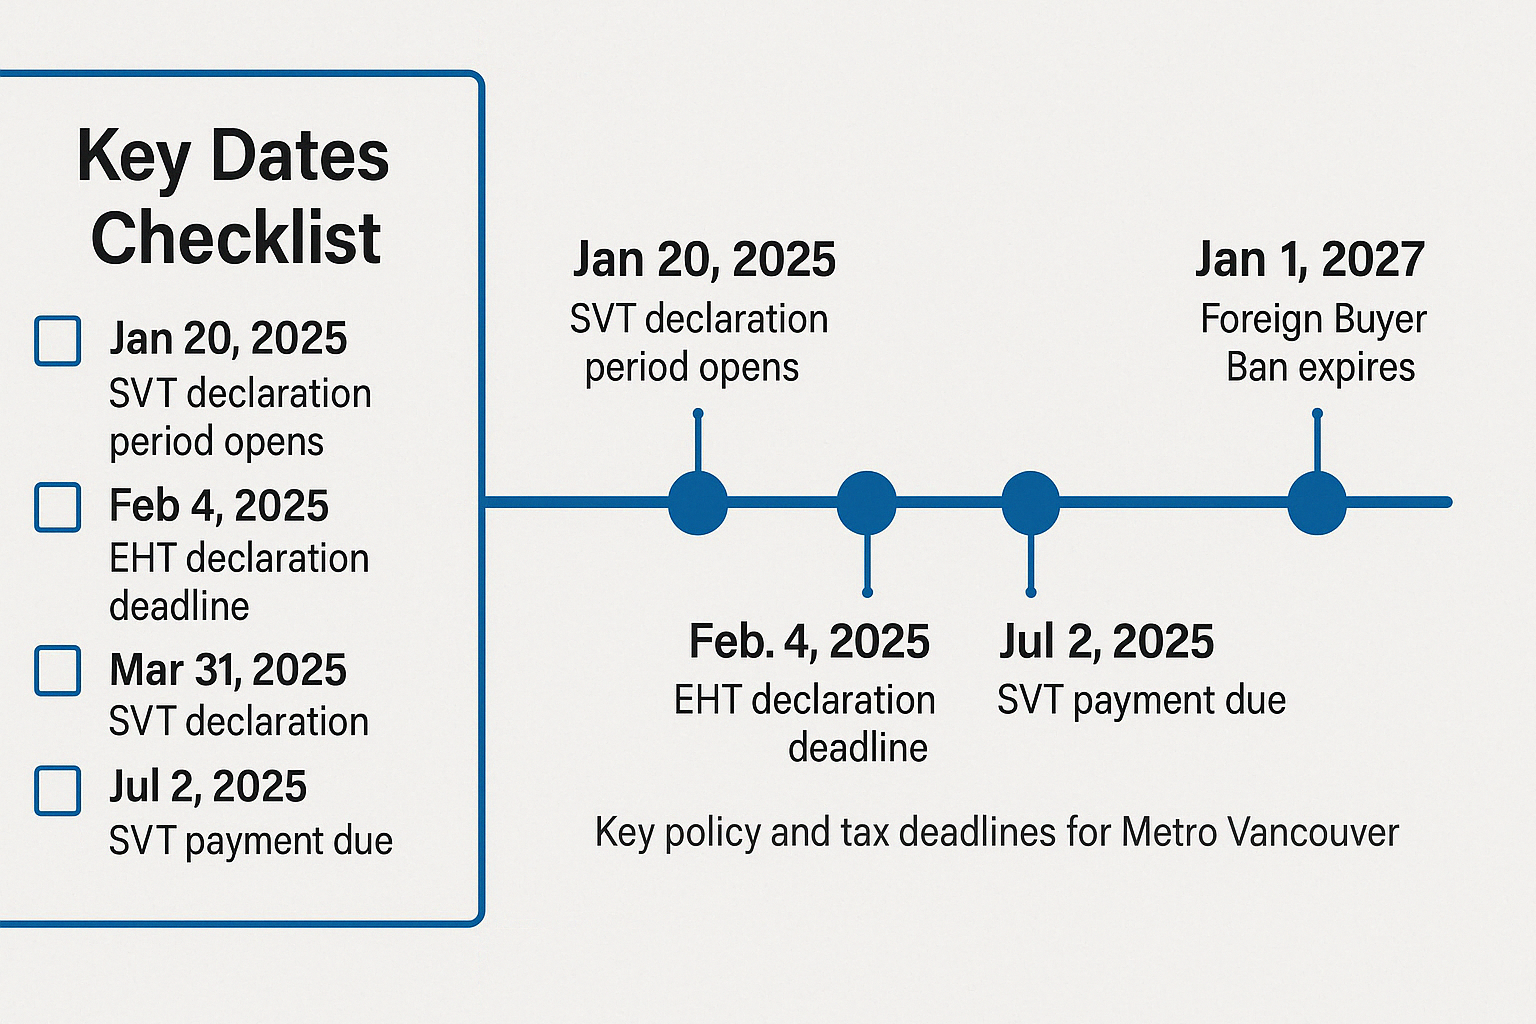
Key policy and tax deadlines for Metro Vancouver
Understanding these measures is crucial for strategic planning. For wider macro and trend analysis, see our Top 10 Real Estate Trends 2025. To integrate these compliance steps into your acquisition process, explore our Step‑by‑Step Buys framework.
Section 4: Financing & Rental Affordability
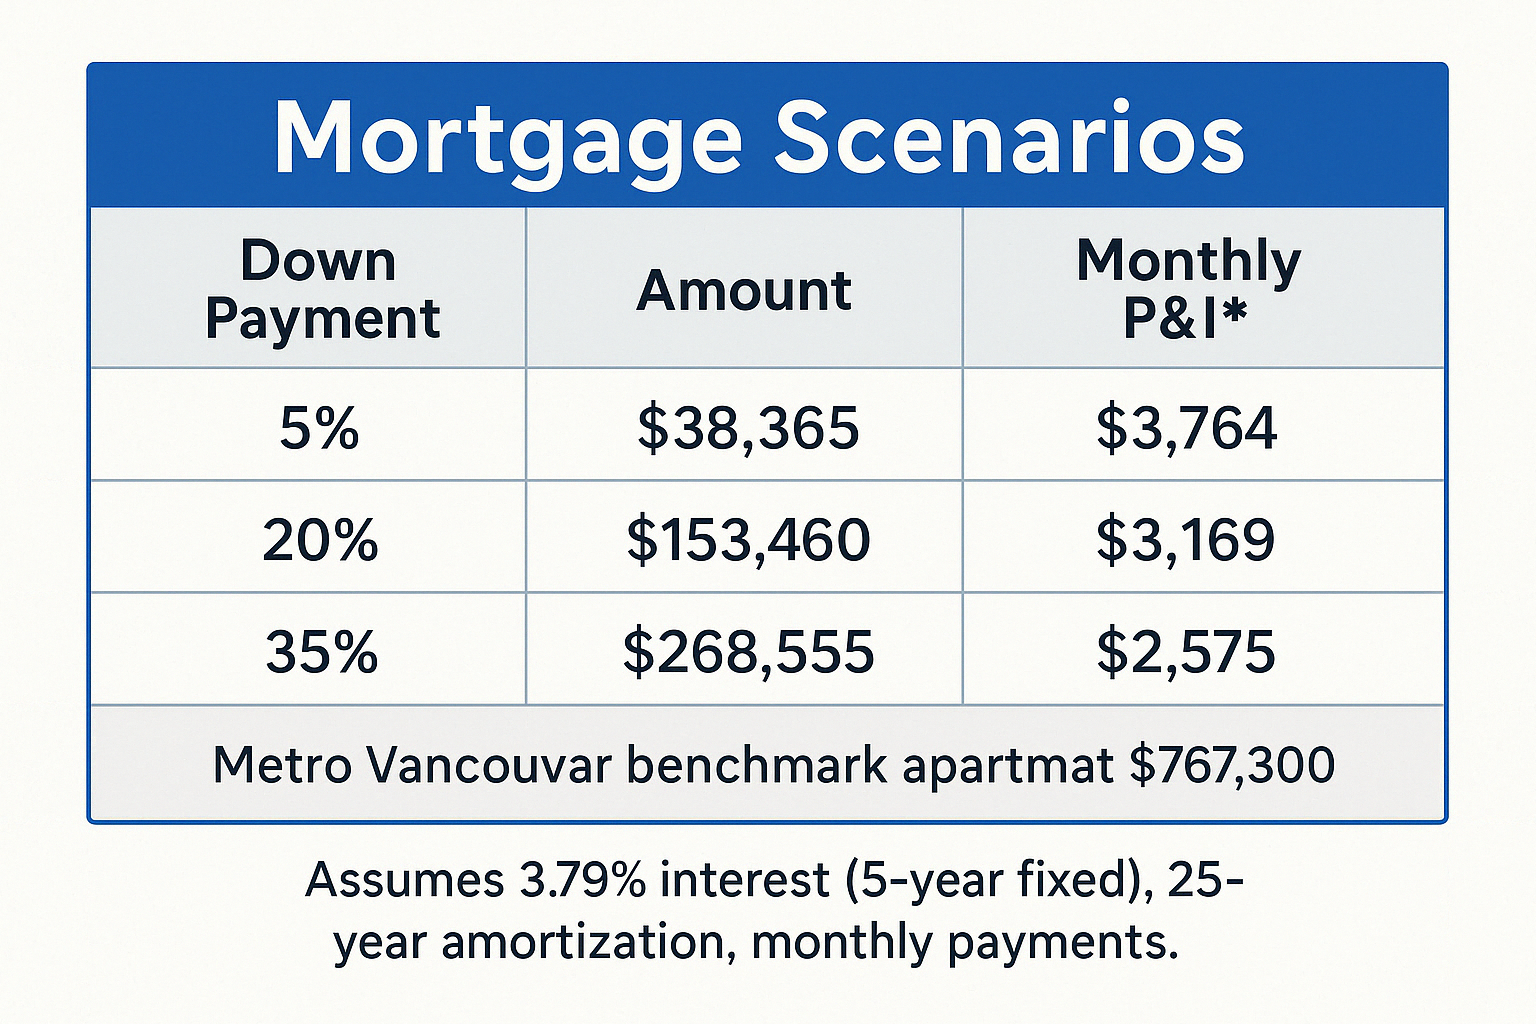
Mortgage rates have trended lower since late 2024, with the average 5‑year high‑ratio fixed rate at 3.79% as of April 18, 2025. Variable‑rate options—tied to the prime rate of 4.95%—remain available but carry re‑set risk. Below, we model monthly principal & interest payments on a $767,300 benchmark apartment at three common down‑payment levels, assuming a 25‑year amortization.
| Down Payment | Amount | Monthly P&I* |
|---|---|---|
| 5% | $38,365 | $3,764 |
| 20% | $153,460 | $3,169 |
| 35% | $268,555 | $2,575 |
*Assumes 3.79% interest (5‑year fixed), 25‑year amortization, monthly payments.
Sample mortgage calculator interface
Rental Yield Analysis
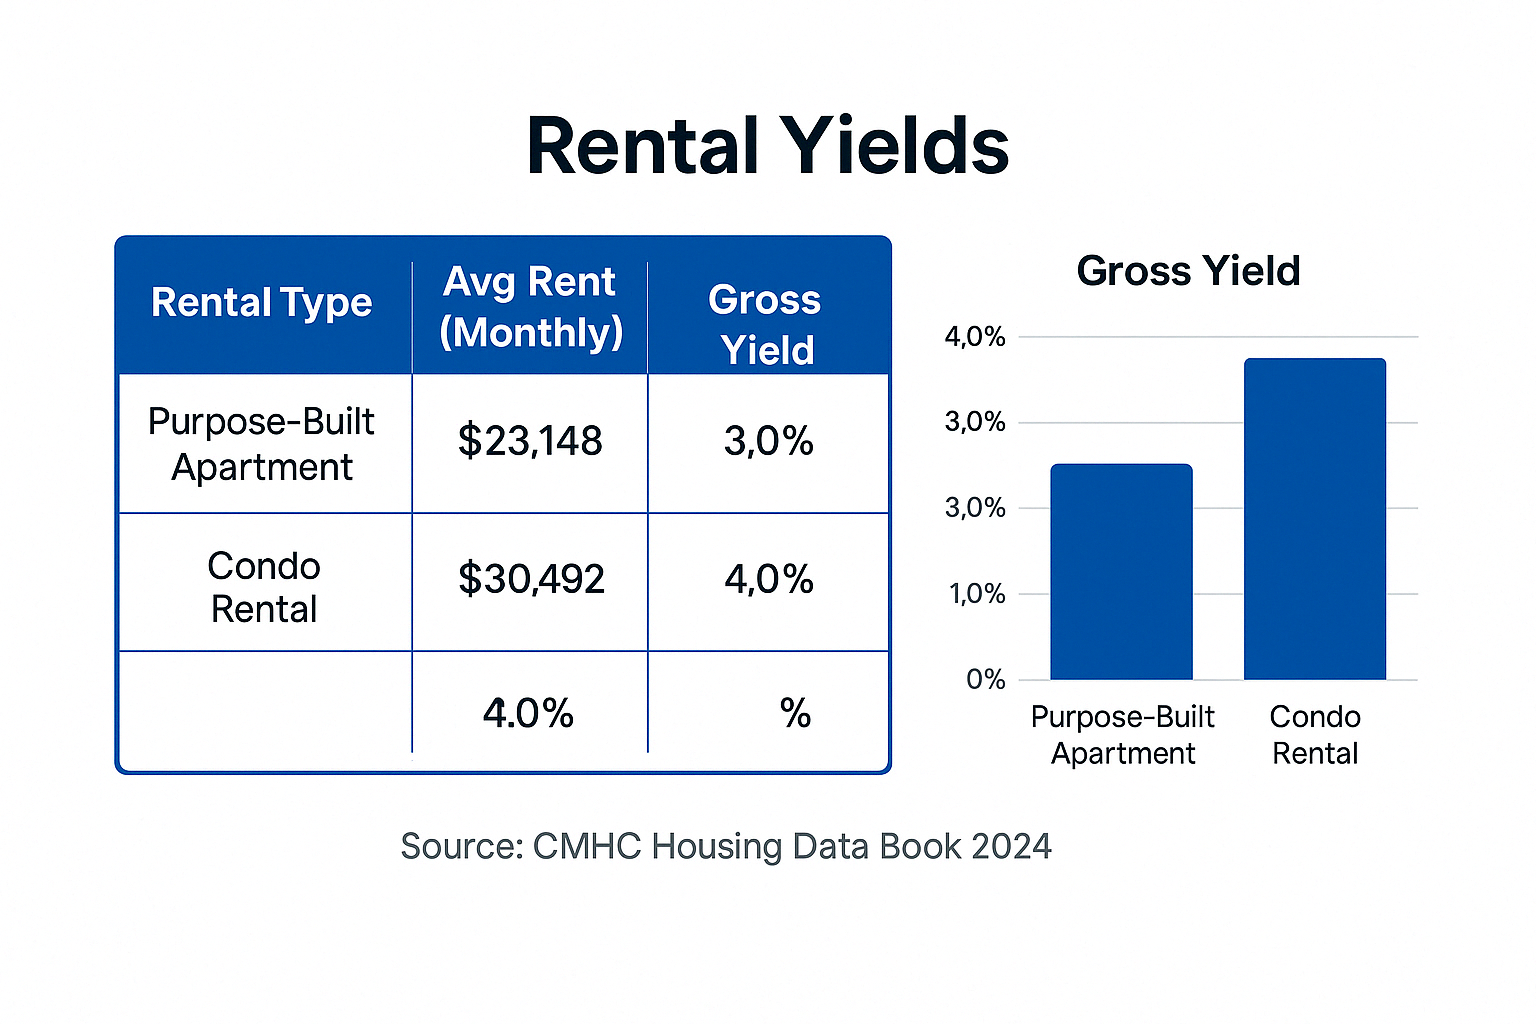
Metro Vancouver’s low vacancy continues to underpin strong rental yields. According to CMHC’s 2024 Housing Data Book, the region’s total vacancy rate was 1.6%, with average monthly rents of $1,929 for purpose‑built apartments and $2,541 for rental condominiums.
| Rental Type | Avg Rent (Monthly) | Annual Rent | Gross Yield | Vacancy Rate |
|---|---|---|---|---|
| Purpose‑Built Apartment | $1,929 | $23,148 | 3.0% | 1.6% |
| Condo Rental | $2,541 | $30,492 | 4.0% | 1.6% |
Source: CMHC Housing Data Book 2024
Rental yield comparison across unit types
Together, steady mortgage costs and solid rental returns create compelling scenarios for both owner‑occupiers and investors. In this section, we’ll translate these figures into two Vancouver‑focused case studies and deliver a step‑by‑step acquisition roadmap.
Section 5: Hypothetical Vancouver Case Studies
To illustrate how data and frameworks translate into real‑world outcomes, we present two hypothetical—but fact‑based—Vancouver scenarios. Each demonstrates key decision points, underwriting assumptions, and performance metrics relevant to today’s market.
Case Study A: Burnaby Duplex House Hack
A young professional couple purchases a Burnaby duplex for $900,000 in March 2025. They finance 95% via a high‑ratio insured mortgage at 3.79% (5‑year fixed), amortized over 25 years.
- Down Payment: 5% ($45,000)
- Mortgage Amount: $855,000 → Monthly P&I: $3,763
- Renovation Budget: $25,000 for cosmetic upgrades
- Rental Income: Spare unit rented at $2,400/month → $28,800 annual
- Net Housing Cost: $3,763 – $2,400 = $1,363/month (15.6% of gross rents)
- Equity Build: ~$10,200 principal paid down in first year
- Appreciation: Assumes 2% annual price growth → ~$18,000 equity gain
After one year, the couple achieves a real return of approximately 21% on their $45,000 down payment, combining cash flow, principal reduction, and appreciation. This aligns with outcomes in our House Hacking guide.
Case Study B: Yaletown Condo Flip
An investor acquires a 650 sq ft Yaletown condo for $800,000 in April 2025, targeting a quick renovation and resale.
- Down Payment (20%): $160,000 → Mortgage $640,000 at 3.79% → $2,817 P&I/month
- Renovation: $75,000 (kitchen, bath, flooring)
- Holding Costs: $4,200/month (mortgage, strata, taxes, utilities) x 4 months = $16,800
- Total Invested: $160,000 + $75,000 + $16,800 = $251,800
- Sale Price: $910,000 after 4 months (assumes 2.5% market gain + value‑add)
- Exit Costs: 1.5% selling commission + 1% closing fees = $24,650
- Net Proceeds: $910,000 – $640,000 paydown – $24,650 = $245,350
- Net Profit: $245,350 – $91,800 (purchase closing & renovation) = $153,550
- ROI: $153,550 / $251,800 = 61% net in 4 months
This flip ROI mirrors findings from our Flip ROI analysis, demonstrating how targeted value‑add can amplify returns even in cooler markets.
Lessons Learned
- Buffer renovations by 10–15% to cover scope creep and permit delays.
- Lock in fixed rates to avoid refinance risk on short‑term flips.
- Prioritize markets with low vacancy and high rental demand for house hacks.
- Monitor seasonal demand cycles—spring flips often yield 1–2% higher multiples.
Section 6: Step‑by‑Step Investment Guide
- Set Clear Objectives: Define target cash‑on‑cash return (e.g., 8–12%) and equity growth (e.g., 4–6%).
- Secure Financing: Obtain pre‑approval from lenders specialized in B.C. insured mortgages and alternate products for higher leverage.
- Research & Narrow Markets: Use MLS® HPI, CMHC rental data, and submarket deep dives to shortlist 3–5 neighbourhoods matching your criteria.
- Underwrite Deals: Build models with conservative assumptions: 10% expense buffer, 5% renovation contingency, 200 bp rate stress‑test.
- Conduct Due Diligence: Order professional inspections (structural, mechanical, environmental), title search, and market comparables analysis.
- Negotiate & Close: Aim for 3–5% below listing on condos, 5–7% on houses; lock in rate holds and closing cost estimates.
- Implement Plan: If a flip, oversee renovations and marketing; if a rental, engage property manager or self‑manage with tenant screening protocols.
- Review & Scale: Track performance quarterly, refinance or 1031‑style exchange into next asset once equity target met.
For full templates, legal checklists, and tax optimization tips, explore our Step‑by‑Step Buys, Builds, and Invest frameworks.
Conclusion & Resources
Metro Vancouver’s Q1 2025 landscape—balanced sales, elevated listings, and targeted policy guardrails—creates both challenges and openings. By leveraging data‑driven insights, adhering to compliance checklists, and following structured execution steps, investors and owner‑occupiers can navigate this market confidently.
Essential further reading:
Real Estate News And Knowledge
Stay informed with the latest trends, insights, and updates in the real estate world.


