Phoenix Arizona Real Estate Investment Guide For 2026
A comprehensive resource for investors looking to capitalize on one of America’s fastest-growing metro economies, with 4.8 million residents, a diversified corporate relocation base, and multiple distinct submarkets spanning entry-level cash flow to luxury appreciation plays
Quick answers: Top 5 most searched Phoenix investment questions ▼
Migration data: Where people are moving from to Phoenix ▼
In This Guide
Click on any section to navigate directly to that content
1. Phoenix Market Overview
Market Fundamentals
Phoenix is the 5th largest city in the United States and anchors one of the country’s most dynamic real estate investment metros. With 4.8 million residents and 75,000 to 100,000 new arrivals annually, the Phoenix metro is experiencing a sustained population-driven housing demand cycle that shows no signs of abating. The city’s combination of no state income tax, business-friendly governance, warm climate, and dramatically lower cost of living than California has made it the premier destination for corporate relocations in the American Southwest.
Key economic indicators defining Phoenix’s investment case:
- Population: 1.65M city, 4.8M+ metro area, growing 75,000-100,000 per year
- Major Employers: Intel, TSMC, Honeywell, American Express, JP Morgan, Charles Schwab, Banner Health, Arizona State University, Luke AFB
- Semiconductor Investment: $60B+ committed by Intel and TSMC in the East Valley corridor
- Median Household Income: $68,000+ metro, $90,000+ East Valley tech corridor
- No State Income Tax: Saves high earners $15,000-$60,000 annually versus California
- Job Growth: Among top 5 metros nationally for job creation annually
The semiconductor investment wave of 2022 to 2026 represents the most significant economic transformation in Phoenix’s modern history. Intel’s $20 billion fab expansion in Chandler and TSMC’s $40 billion campus near north Phoenix and Scottsdale are creating tens of thousands of high-paying technical jobs that are reshaping housing demand patterns across the entire metro.
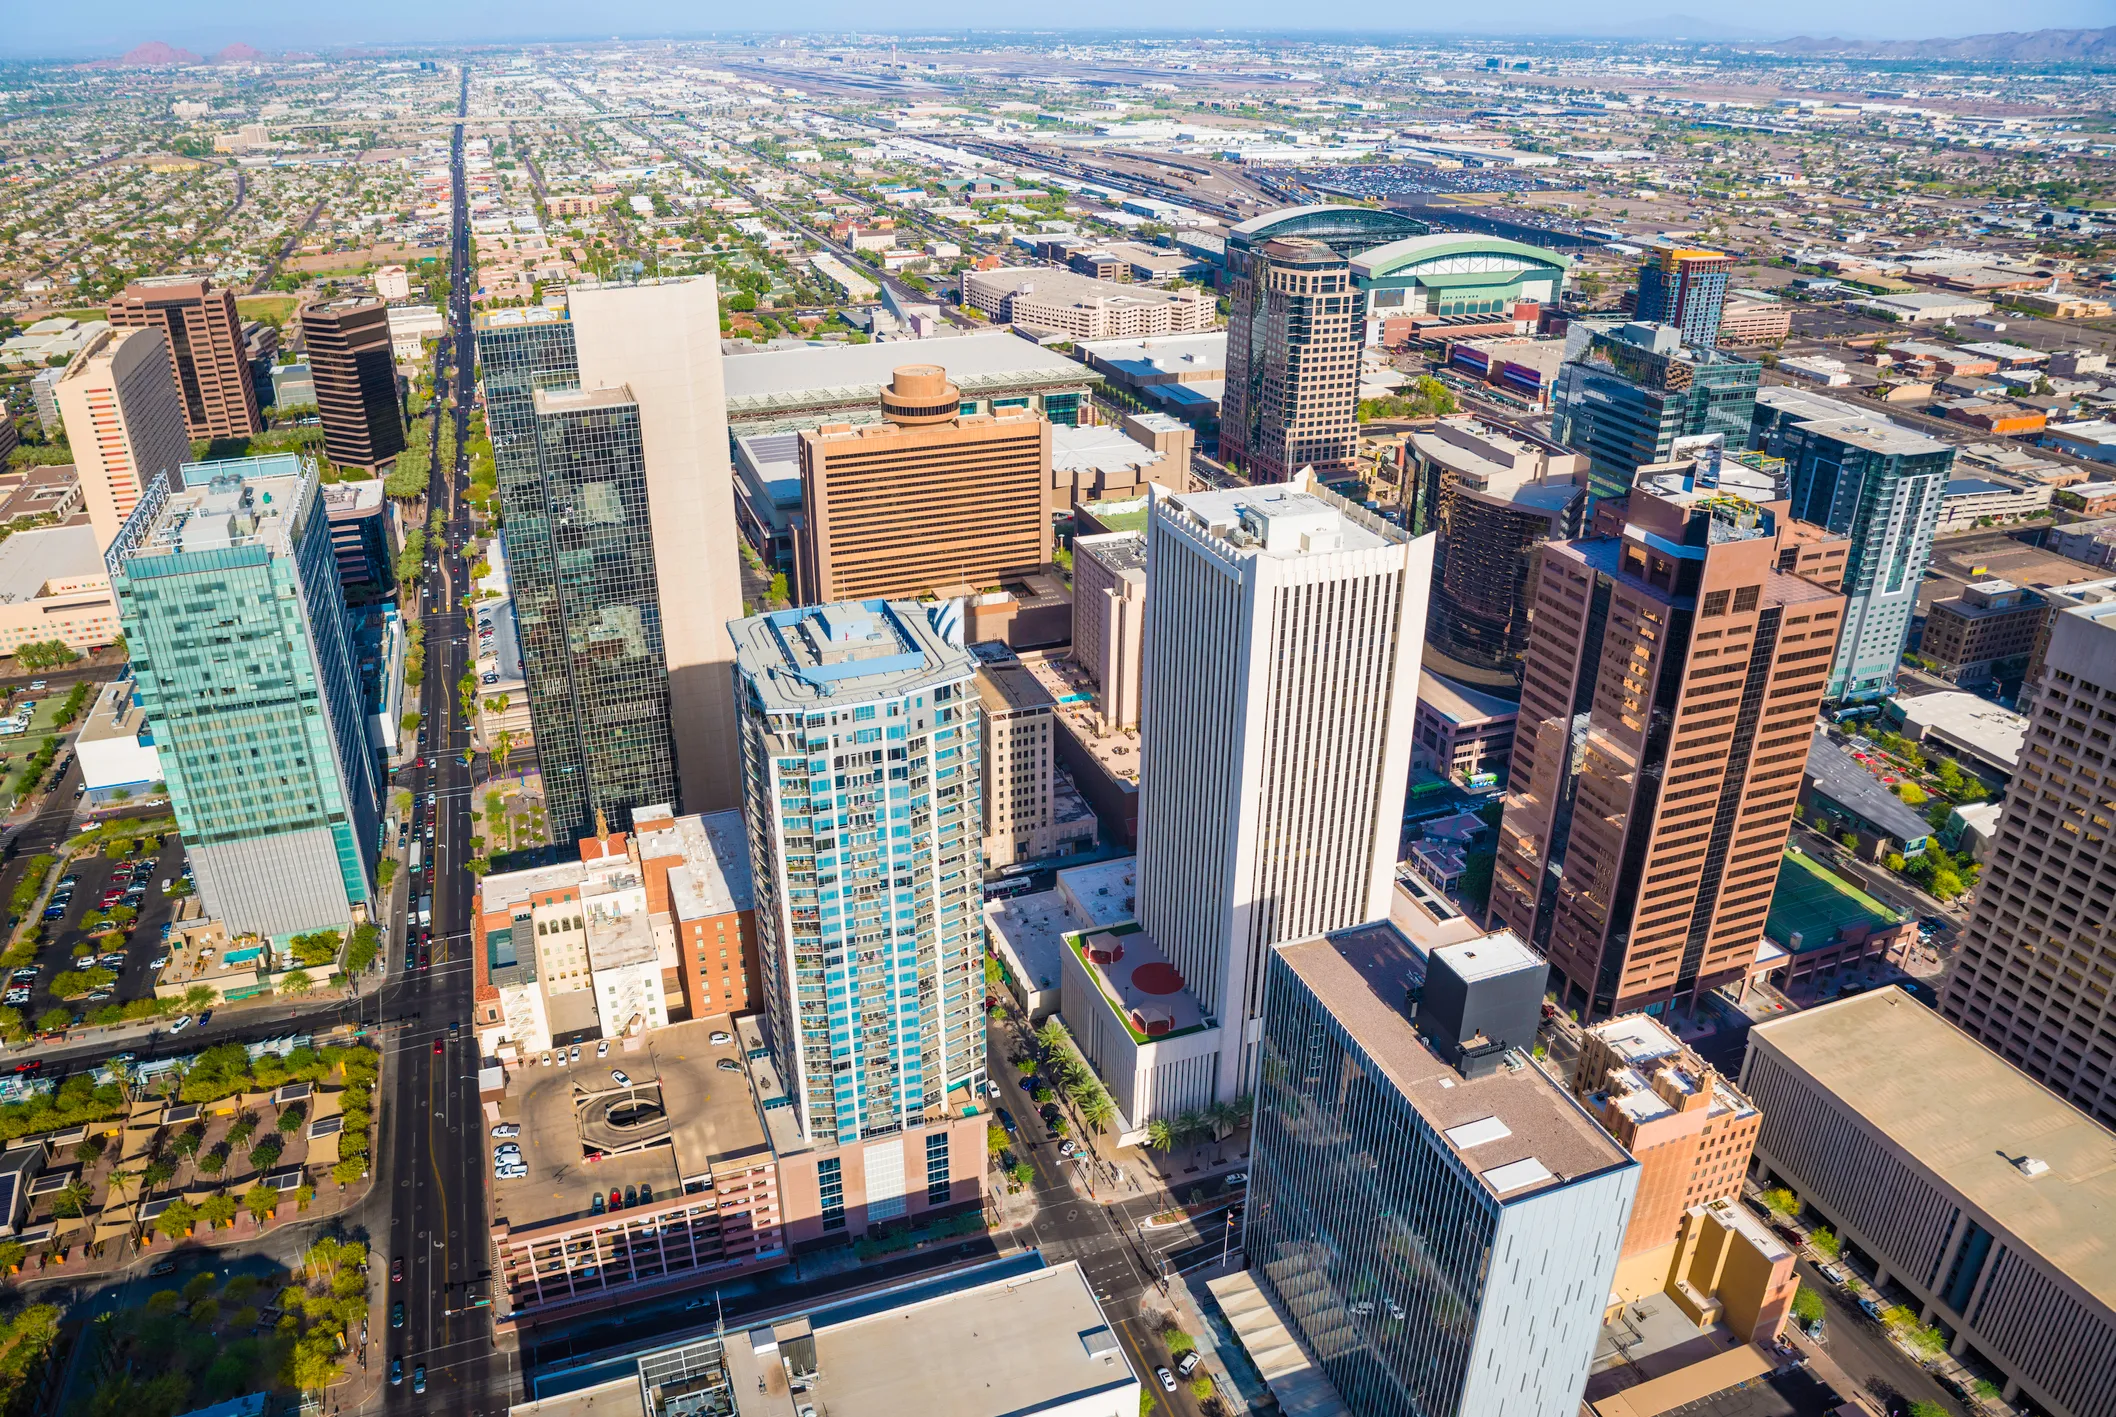
Phoenix’s sprawling skyline reflects a city in continuous expansion, driven by population growth, corporate relocations, and semiconductor investment
2026 Economic Outlook
- TSMC Phase 1 production ramping at north Phoenix campus
- Intel Chandler fab expansion reaching full operational capacity
- Financial services sector expanding with JP Morgan, Goldman Sachs operations
- ASU research partnerships driving biotech and tech startup activity
- Light rail expansion creating new transit-oriented investment corridors
Investment Climate
Phoenix’s investment environment is defined by a powerful tension that every investor must honestly evaluate: exceptional long-term appreciation potential offset by negative to break-even cash flow in most submarkets at current prices and interest rates. The investors who succeed in Phoenix share specific characteristics:
- Appreciation-first orientation understanding that Phoenix’s total return over 5 to 10 year holds has consistently exceeded most U.S. markets even though annual cash flow is negative
- Strong income or equity backing to carry negative cash flow without financial stress during hold periods
- Submarket selectivity targeting specific employment growth corridors rather than buying Phoenix generally
- Long time horizons of 7 to 15 years to ride through any correction cycles and capture full appreciation upside
- West Valley awareness recognizing that Buckeye, Goodyear, and outer suburbs offer closer to cash flow neutrality than core East Valley or Scottsdale locations
Historical Performance
| Period | Market Driver | Avg Annual Appreciation | Key Event |
|---|---|---|---|
| 2010-2014 | Post-crisis recovery, foreclosure clearing | 8-12% | Institutional investors bought distressed inventory in bulk |
| 2015-2019 | Corporate relocations, California migration | 6-9% | Financial services and tech companies establishing Phoenix presence |
| 2020-2022 | Pandemic migration, remote work wave | 20-30% | Phoenix ranked #1 appreciation market nationally; inventory hits historic lows |
| 2023-2024 | Rate shock, correction | -5 to +4% | Price correction created healthier entry environment; semiconductor announcements sustain demand |
| 2025-2026 | Semiconductor ramp-up, rate stabilization | 8-14% (projected) | TSMC and Intel employment driving East Valley premium; broader metro recovery underway |
Phoenix’s long-term track record is one of the strongest of any major U.S. city. A property purchased in Phoenix in 2010 at the post-crisis trough would have appreciated 200 to 300 percent by 2026, representing one of the best wealth-building outcomes available in American real estate over that period. The 2008 to 2010 crisis was severe for Phoenix, but the recovery was faster and more complete than in most comparable markets.
Demographic Trends Driving Demand
- California Migration – 70,000+ Californians annually, many keeping California-scale salaries while paying Arizona taxes and housing costs, creating sustained premium demand
- Semiconductor Workforce – TSMC and Intel combined represent $60B+ in local investment and tens of thousands of high-income technical jobs at wages well above Phoenix median
- Financial Services Expansion – JP Morgan, Goldman Sachs, Charles Schwab, and American Express have major and growing Phoenix operations drawing finance professionals nationally
- Arizona State University – One of the largest universities in the U.S. with 100,000+ students creating permanent young renter demand near Tempe campus
- Luke AFB and Military – Luke Air Force Base in Glendale adds stable government employment to the West Valley’s demand base
- Healthcare Sector – Banner Health, Mayo Clinic, Honor Health, and Dignity Health collectively employ over 60,000 in the metro, adding recession-resistant demand across all submarkets
📚 New to real estate investing? Master the fundamentals with our professional course Learn more →
2. Neighborhood Hotspots
Phoenix Metro Investment Neighborhood Map
Interactive map of Phoenix metro investment neighborhoods. Green stars show top hotspots, blue circles mark established markets, and orange circles highlight emerging areas.
Core Investment Neighborhoods
Detailed Submarket Analysis: Phoenix Metro
| Submarket | Price Range (SFH) | Cap Rate | Growth Drivers | Best Strategy |
|---|---|---|---|---|
| Scottsdale / Paradise Valley | $650K-$2M+ | 3.5-4.5% | Luxury tourism, finance, high-end lifestyle | Appreciation play, luxury rental, vacation rental |
| Chandler | $420K-$700K | 4.5-5.5% | Intel, semiconductor corridor, top schools | Tech professional rentals, long-term hold |
| Gilbert | $400K-$650K | 4.5-5.5% | Top schools, family demand, East Valley employment | Family rentals, long-term holds, minimal maintenance |
| Tempe | $350K-$600K | 5-6% | ASU, tech corridor, light rail, urban lifestyle | Student housing, urban multi-family, condo |
| Mesa | $310K-$520K | 5-6% | Affordability, aerospace, light rail, downtown renewal | Cash flow balance, value-add, BRRRR |
| Peoria | $340K-$550K | 4.5-5.5% | Healthcare, sports venues, family demand | Stable family rentals, long-term hold |
| Glendale | $320K-$490K | 5-6% | Luke AFB, sports, manufacturing, affordability | Military housing, workforce rentals, cash flow |
| Surprise | $310K-$490K | 5-6.5% | Spring training, West Valley growth, active adult | Cash flow, active adult, spring training rental |
| Goodyear | $330K-$520K | 5-6.5% | Manufacturing, Luke AFB, West Valley growth | Workforce housing, military, positive cash flow |
| Buckeye | $285K-$450K | 5.5-6.5% | Fastest growth in AZ, new infrastructure, affordability | Best Phoenix cash flow, new construction, long-term growth |
| Queen Creek | $360K-$560K | 5-6% | Southeast growth, new communities, good schools | Family rentals, new construction, East Valley spillover |
| Central Phoenix / South Phoenix | $220K-$500K | 5-8% | Urban renewal, light rail, revitalization, value-add | BRRRR, value-add, transitional area appreciation |
Expert Insight: “The most significant near-term Phoenix investment thesis that most investors are missing is the TSMC effect on north Phoenix and the surrounding areas. When TSMC’s Phase 2 comes fully online, the housing demand from engineers and technical staff earning $150,000 to $300,000 will reshape the north Phoenix corridor the way Intel reshaped Chandler over the past decade. Properties within a 15-minute commute of the TSMC campus that you can buy today at standard Phoenix valuations will trade at a significant semiconductor premium in 3 to 5 years. We are telling clients to move now while that premium is not yet fully priced in.” – Marcus Chen, Phoenix Investment Properties, Southwest Capital Advisors
3. Property Types
| Investment Goal | Best Property Type | Best Neighborhoods | Minimum Capital |
|---|---|---|---|
| Maximum Appreciation | SFH near semiconductor employers | Chandler, North Phoenix TSMC area | $110,000-$180,000 |
| Best Phoenix Cash Flow | West Valley SFH or new construction | Buckeye, Goodyear, Surprise | $75,000-$120,000 |
| Balanced Returns | SFH in established tech corridor | Tempe, Mesa, Gilbert | $90,000-$150,000 |
| Best Value-Add | BRRRR renovation in revitalizing corridor | South Phoenix, Central Phoenix | $65,000-$110,000 |
Don’t guess the costs. Our Complete Renovation & Remodeling Cost Guide covers 400+ pages of project-by-project breakdowns with real contractor pricing ranges.
4. Cost Analysis
Acquisition Cost Breakdown (Phoenix)
| Expense Item | Typical Cost | Example ($450,000 Property) | Notes |
|---|---|---|---|
| Down Payment | 25% (investment) | $112,500 | 20% possible with strong credit; 25% standard for investment |
| Closing Costs | 2-3% of price | $9,000-$13,500 | Title, escrow, lender fees; Arizona title rates competitive |
| General Inspection | $350-$550 | $450 | HVAC condition critical; Phoenix summers run systems hard |
| Termite Inspection | $75-$150 | $100 | Required by most lenders; subterranean termites active in Phoenix |
| Initial Repairs | 0-5% of price | $0-$22,500 | Newer construction needs less; older homes may need HVAC, roof work |
| Reserves (6 months) | 6 months expenses | $12,000-$18,000 | Covers negative cash flow carry and emergency repairs |
| TOTAL MINIMUM ENTRY | ~30-35% of value | $134,050-$166,550 | Larger capital requirement than Tucson or Casa Grande; higher appreciation potential |
Sample Cash Flow Analysis: Chandler 3BR Tech Corridor SFH
| Item | Monthly | Annual | Notes |
|---|---|---|---|
| Gross Rent | $2,400 | $28,800 | 3BR, Chandler, near Intel campus, updated condition |
| Less Vacancy (5%) | -$120 | -$1,440 | Conservative; well-located Chandler homes often at 3% vacancy |
| Property Taxes | -$350 | -$4,200 | Maricopa County rate approximately 0.8% of assessed value |
| HOA (if applicable) | -$100 | -$1,200 | Many Chandler communities have HOAs; verify before purchase |
| Insurance | -$140 | -$1,680 | Landlord policy; Arizona rates moderate |
| Property Management (9%) | -$216 | -$2,592 | Chandler rates competitive; quality management widely available |
| Maintenance + CapEx | -$240 | -$2,880 | 10% of rent; HVAC reserve critical in Phoenix climate |
| Net Operating Income | $1,234 | $14,808 | Before mortgage |
| Mortgage ($500K purchase, 25% down, 7.0%, 30yr) | -$2,491 | -$29,892 | On $375,000 loan balance |
| CASH FLOW | -$1,257 | -$15,084 | Negative; investor is carrying $1,257/month in exchange for appreciation |
| Cap Rate | 2.96% | NOI / Purchase Price | |
| Total Return (11% appreciation) | ~22% | Appreciation + equity paydown on invested capital, net of negative carry |
The Phoenix math explained: Carrying $1,257 per month in negative cash flow costs $15,084 annually. On a $500,000 property appreciating at 11 percent, equity gained is $55,000. Net of the negative carry, the investor creates $39,916 in net wealth annually on $125,000 invested capital, a 32 percent net return. This is the core Phoenix investment case: negative cash flow is the cost of access to one of America’s strongest appreciation markets. Investors who cannot comfortably absorb the monthly carry should target the West Valley for better cash flow, or Tucson and Casa Grande for genuine positive cash flow.
Expert Insight: “The investors who struggle in Phoenix are the ones who buy in the East Valley and expect cash flow. The investors who thrive are the ones who buy with a 10-year lens and treat the monthly negative carry as an investment expense rather than a problem. A Chandler home purchased in 2014 for $250,000 is worth roughly $600,000 today. The $800 per month negative carry over that period totaled about $96,000. The net gain after carrying costs was approximately $254,000 on a $65,000 original down payment. No other Arizona market produces that kind of leveraged return. The carry is the price of admission.” – Jennifer Walsh, Phoenix Investment Real Estate, Desert Capital Group
5. Legal Framework
✅ Phoenix Is One of the Most Landlord-Friendly Major Cities in America
The City of Phoenix adds no additional tenant protections on top of Arizona’s already landlord-favorable state law. No rent control, no just cause eviction ordinance, no source of income protection, and no additional screening restrictions. Evictions are efficient, security deposits are manageable, and landlords retain full discretion to set rents and choose not to renew leases. For investors transitioning from California, Seattle, or other highly regulated markets, Phoenix’s legal environment is a dramatic improvement in operating conditions.
Arizona Landlord-Tenant Law in Phoenix
Phoenix landlords operate under the Arizona Residential Landlord and Tenant Act through Maricopa County Justice Court:
- Non-Payment Eviction: 5-day pay-or-quit notice. Court filing available on day 6. Hearing within 2 to 3 weeks. Full execution within 25 to 35 days of notice. One of the fastest eviction processes in the country.
- Lease Violation: 10-day notice to cure. Immediate notice for non-curable violations.
- No-Cause Termination: 30-day notice to end a month-to-month tenancy. No cause or justification required. Full flexibility at every lease renewal.
- Security Deposit: Maximum 1.5 months rent. Must be returned within 14 business days of move-out with itemized deduction statement.
- Rent Control: Prohibited statewide by Arizona law. City cannot impose any rent restrictions.
- Rent Increase: No restrictions on amount. 30-day notice for month-to-month tenants.
- HVAC Habitability: Landlord must maintain working HVAC. Phoenix summer temperatures make same-day HVAC response a legal necessity, not a preference.
- Entry Notice: 2 business days required for non-emergency entry.
Phoenix-Specific Compliance Considerations
While Phoenix’s regulatory environment is simple, these specific compliance areas require attention:
- HOA Compliance: Many Phoenix metro properties are in HOAs that have their own rental rules. Some master-planned communities limit the percentage of rental properties, require HOA approval of tenants, or restrict short-term rentals. Verify HOA rules before purchasing any HOA-governed property.
- Short-Term Rental Registration: Arizona allows STRs statewide but cities can require registration. Phoenix requires STR operators to register and obtain a license. Verify current requirements at phoenix.gov before listing.
- Pool Safety: Phoenix properties with pools must comply with fencing and safety requirements. Pool liability exposure is significant; verify insurance coverage and safety compliance before listing.
- Habitability Standards: Working HVAC, plumbing, and weatherproofing are required. HVAC failure in Phoenix summer creates both habitability liability and tenant relations risk.
- Entity Structure: LLC ownership is strongly recommended for Phoenix investors. Arizona single-member LLCs provide liability protection at low annual cost.
- Fair Housing: Federal Fair Housing Act applies fully in Phoenix. Standard professional screening criteria consistently applied to all applicants.
Useful Phoenix Resources
- Arizona Residential Landlord and Tenant Act: azleg.gov
- Maricopa County Justice Court: justicecourts.maricopa.gov
- Arizona Multihousing Association: az-mha.org
- Phoenix Short-Term Rental Registration: phoenix.gov
| Regulation | Phoenix / Arizona | California / Seattle Comparison | Investor Impact |
|---|---|---|---|
| Eviction Timeline | 25-35 days | 3-12+ months | Dramatically lower non-payment risk; quick resolution |
| Rent Control | Prohibited statewide | Active in many jurisdictions | Full market rate flexibility at every lease renewal |
| Just Cause | Not required | Required in Seattle and many CA cities | Full control over tenant selection at lease end |
| Security Deposit Cap | 1.5 months rent | 2 months / varies | Moderate protection; document condition thoroughly |
| STR Rules | Permitted with city registration | Heavily restricted in many cities | STR income opportunity with straightforward licensing |
6. Step-by-Step Phoenix Investment Playbook
Define Your Phoenix Strategy Before You Buy
Phoenix demands strategic clarity because the right submarket depends entirely on your financial position and investment goals. The four viable Phoenix strategies:
Semiconductor Corridor Play
Buy near Intel in Chandler or TSMC in north Phoenix. Accept significant negative cash flow in exchange for exposure to the highest-appreciation submarket in Arizona. Requires strong W-2 income to carry monthly losses. 10-year minimum hold. Best total return trajectory in Phoenix metro.
West Valley Cash Flow
Buy in Buckeye, Goodyear, or Surprise. Achieve near-neutral or modestly positive cash flow while participating in Phoenix metro appreciation. Lower absolute appreciation than East Valley but far less carrying cost stress. Best entry point for new Phoenix investors.
Urban Value-Add (BRRRR)
Buy 1960s to 1980s homes in central and south Phoenix revitalization corridors. Renovate to market standard. Achieve improved rents and ARV. Refinance equity, repeat. Moderate cash flow after renovation with strongest appreciation trajectory of older Phoenix stock.
ASU / Tempe Balanced
Buy condos or small multi-family near ASU and the Tempe light rail corridor. Target young professional and student tenants. Best balance of cash flow and appreciation in the inner metro. Requires understanding of HOA rules and ASU rental cycle dynamics.
Build Your Phoenix Team
Phoenix’s scale means specialist knowledge matters. Non-negotiable team members:
- Phoenix Investment-Focused Agent: Must understand submarket dynamics specifically. An agent who primarily serves owner-occupants will not understand semiconductor corridor appreciation analysis or West Valley cash flow optimization.
- Arizona Real Estate Attorney: For LLC setup and lease template review. Phoenix HOA environments make prior HOA document review by an attorney worthwhile on any purchase above $500,000.
- Phoenix Property Manager: Phoenix has an excellent pool of professional management companies. Verify they manage properties in your target submarket specifically and ask about their average days-to-lease metrics.
- Arizona Investment CPA: For depreciation strategy, entity structuring, and Maricopa County property tax appeal procedures. Phoenix properties are frequently over-assessed; an experienced CPA or tax consultant can recover thousands annually through appeals.
- Contractor for Value-Add: If targeting BRRRR, your contractor must know Phoenix city permit requirements and desert-specific construction (HVAC sizing, flat roof systems, stucco exterior).
Expert Tip: Ask every Phoenix property manager candidate: “What is your average days-to-lease for a 3-bedroom in [your target submarket]?” Top managers in Chandler and Gilbert average 8 to 15 days. West Valley averages 12 to 20 days. Managers who cannot give you a specific number for your target area are telling you they do not manage enough in that area to have the data.
Phoenix-Specific Due Diligence
Physical Due Diligence
- HVAC age, condition, and remaining life (critical; $8,000-$14,000 replacement in Phoenix)
- Roof condition (tile roofs common; flat foam roofs on older homes need specialized assessment)
- Termite inspection (mandatory for most lenders; endemic to Phoenix Valley)
- Pool condition if present (evaporation, liability, maintenance cost)
- Window insulation (single-pane windows in older homes drive high utility costs)
- Irrigation system and landscaping water costs
- Stucco condition and cracking patterns
Market and HOA Due Diligence
- HOA rules: rental caps, tenant approval requirements, STR restrictions
- HOA financials: reserve fund adequacy, any pending special assessments
- Verify actual rental comps from management company data, not Zillow estimates
- Confirm commute time to target employer hubs (Intel, TSMC, financial district)
- Check for any planned developments or zoning changes nearby
- Review existing tenant lease, payment history, and security deposit documentation
- Maricopa County assessed value versus purchase price for tax appeal analysis
Compete and Operate Successfully
Phoenix is a competitive market that has attracted significant institutional investment. Operating successfully requires:
- Price rents at market, not above: Phoenix tenants have options and will quickly identify over-priced rentals. A property sitting vacant for 30 days at $2,500 costs more than pricing at $2,350 and filling in 8 days. Use property manager rental comps aggressively.
- Invest in HVAC proactively: Phoenix summer HVAC failure is an emergency. Annual service ($150 to $250), replace units approaching 12 years, and budget for replacement rather than waiting for failure.
- Manage HOA compliance: In HOA communities, lease violations that trigger HOA fines fall on the landlord. Include HOA rules in your lease and educate tenants on compliance obligations at move-in.
- Consider property tax appeals: Maricopa County often assesses investment properties at inflated values. Annual appeals through the County Assessor process can recover $300 to $1,500 annually in reduced property taxes. Many property tax consultants work on contingency.
- Leverage professional management fully: Phoenix’s competitive rental market and active investor community means professional management quality matters. Best-in-class managers get homes leased 15 to 20 days faster than average operators, which at $2,400 monthly rent means $1,200 to $1,600 in avoided vacancy costs per vacancy event.
7. Financing Options for Phoenix
| Loan Type | Down Payment | Rate Premium | Best For | Phoenix Note |
|---|---|---|---|---|
| Conventional Investment | 20-25% | +0.5-0.75% | Strong W-2 income, good credit, under $806K | Most West Valley properties under conforming limit; straightforward |
| Conventional Jumbo | 25-30% | +0.75-1.25% | Chandler, Scottsdale properties above conforming limit | Common for East Valley investment; Phoenix lender market deep and competitive |
| DSCR Loan | 20-25% | +1.5-2.5% | Self-employed investors, no income verification | Phoenix cap rates make DSCR qualification difficult in most submarkets; possible in West Valley |
| House Hacking (FHA) | 3.5% | Standard + MIP | Owner-occupying one unit of 2-4 unit property | Best low-capital entry into Phoenix market; Tempe multi-family ideal |
| Portfolio Loan | 20-30% | +1-2% | Multiple Phoenix properties, portfolio growth | Several Arizona lenders offer competitive portfolio programs for 5+ property investors |
| Hard Money / Bridge | 15-25% | 8-12% rate | BRRRR, competitive offers, value-add acquisitions | Active Phoenix hard money market; Maricopa County BRRRR cycle well-understood by lenders |
| 1031 Exchange Reinvestment | Equity from sold property | Standard rates | Reinvesting capital gains from property sales | Phoenix is a top 1031 exchange destination; significant California equity arriving regularly |
Phoenix Financing Reality: Phoenix’s cap rates make DSCR loan qualification difficult in most East Valley submarkets because the debt service coverage ratio falls below 1.0x at current rental rates and interest rates. Most Phoenix investors use conventional or jumbo loans requiring full income documentation. The silver lining is that strong W-2 income from tech employment, financial services, or healthcare is abundant among Phoenix area investors, and the metro’s lender market is highly competitive with multiple banks actively courting investment property borrowers.
8. Frequently Asked Questions
Knowledge Quiz: Phoenix Real Estate Investment
Open Quiz
5 quick questions on what you just learned about Phoenix investing
1) What makes Chandler the leading Phoenix appreciation submarket in 2026?
Answer: C
Intel’s massive Fab 52 and Fab 62 expansion in Chandler is creating thousands of high-paying engineering and technical jobs. The guide describes Chandler as “the epicenter of Arizona’s semiconductor economy” with workers earning $100,000 to $200,000+ driving premium rental demand. The guide also notes the TSMC campus is in north Phoenix, not Chandler.
2) What is the honest assessment of cash flow in Phoenix’s East Valley?
Answer: B
The guide is direct: expect negative $500 to $1,500 per month cash flow in the East Valley with conventional 25 percent down investment financing at 7 percent rates. The guide frames this as the cost of access to one of America’s strongest appreciation markets, not a problem with the investment thesis. The sample cash flow table shows $1,257 monthly negative carry on a $500,000 Chandler property.
3) Which Phoenix submarket offers the best path to near-neutral cash flow?
Answer: D
The guide specifically identifies Buckeye and the West Valley as offering negative $100 to positive $200 per month cash flow, compared to negative $500 to $1,500 in the East Valley. The guide describes Buckeye as “the only part of the Phoenix metro where cash flow neutrality is realistic for most investors” at current prices.
4) What critical HOA issue can eliminate your investment strategy entirely in Phoenix?
Answer: A
The guide specifically warns that some Phoenix HOAs “limit the percentage of homes in a community that can be rented” and that if a community is at its rental cap, the investor cannot rent until a current rental slot opens. The guide calls this a problem that can “eliminate your investment strategy entirely” if discovered after closing, which is why reviewing HOA rules before making an offer is essential.
5) How does the guide frame the total return case for accepting Phoenix negative cash flow?
Answer: B
The guide walks through the specific math: on a $500,000 Chandler property appreciating at 11 percent, the investor gains $55,000 in equity annually. After subtracting $15,084 in annual negative carry, the net wealth creation is approximately $39,916. On $125,000 invested capital, that is roughly a 32 percent net annual return. The guide frames the negative carry explicitly as “the price of admission” to Phoenix’s strong appreciation market, not a flaw in the investment.
Work With a Local Expert in Phoenix
We are building a verified network of real estate professionals across every market we cover.

About Our Expert Network
We are finalizing partnerships with verified real estate professionals across every market featured on Builds and Buys. Each expert in our network is selected for their hands-on investment experience, local market knowledge, and commitment to helping investors make sound decisions across Phoenix’s many distinct submarkets.
- Proven experience across East Valley, West Valley, and urban Phoenix investment submarkets
- Deep knowledge of semiconductor corridor appreciation dynamics
- HOA compliance expertise and rental rule navigation
- Access to off-market and pre-market opportunities across the metro
- Full transaction support from search through closing
Services Covered
- Property sourcing and acquisition
- Investment analysis and underwriting
- Buyer representation
- HOA compliance guidance
- Value-add and renovation guidance
- Semiconductor corridor analysis
- Legal and title referrals
- Financing and lender connections
- Property management referrals
- 1031 exchange coordination
- Exit strategy planning
- Portfolio growth strategy
Get Connected or Join Our Network
Looking for a Phoenix area expert? Reach out and we will connect you with the right professional for your target submarket and strategy.
Contact us at support@buildsandbuys.com
Find Specialized Phoenix Real Estate Professionals
Ready to Invest in Phoenix?
Phoenix is one of the most compelling long-term real estate investment cities in North America. The combination of no state income tax, the largest semiconductor investment in American history, 75,000 to 100,000 new residents annually, a business-friendly government, and Arizona’s landlord-favorable legal environment creates a structural investment case that has consistently rewarded patient, well-capitalized investors over every 5 to 10 year holding period. Success in Phoenix requires honest self-assessment, submarket specificity, and the financial strength to carry negative cash flow without stress, but for investors who enter with their eyes open, Phoenix delivers.
Continue Your Research
Arizona State Guide
See how Phoenix compares to Tucson, Scottsdale, Flagstaff, and all other Arizona markets.
Step-by-Step Invest
Complete framework for building a real estate investment strategy from scratch.
144-Lesson Course
University-level real estate education covering financing, law, strategy, and management.
For further guidance, explore our State-by-State Investor guides, browse our expert articles, or follow our Step-by-Step Investment Guide.


