San Francisco Real Estate Investment Guide For 2026
A comprehensive resource for investors targeting one of the world’s most supply-constrained cities, a global technology and finance capital where structural housing scarcity and 66 percent renter occupancy create a compelling long-term wealth-building case
Quick answers: Top 5 most searched San Francisco investment questions ▼
Migration data: Who is moving to and within San Francisco ▼
In This Guide
Click on any section to navigate directly to that content
1. San Francisco Market Overview
Market Fundamentals
San Francisco is a 7-by-7-mile peninsula anchored between the Pacific Ocean and San Francisco Bay with no land remaining for outward expansion. It is the highest-income major city in the United States, home to the world’s highest concentration of venture capital and artificial intelligence research, and a city where 66 percent of residents rent because ownership prices are structurally beyond the reach of even high earners. This combination of permanent geographic supply constraints, extraordinary income concentration, and a dominant renter majority has made SF one of the most resilient long-term appreciation markets in the world, even through its pronounced cyclical corrections.
Key economic indicators that define the SF investment case:
- Population: 873,000 city; 4.7M Bay Area metro
- Median Household Income: $136,000, highest of any major U.S. city
- Renter Rate: 66%, among the highest in the nation
- Major Employers: Salesforce, Airbnb, Twitter/X, Stripe, Lyft, OpenAI, Anthropic, Cloudflare, Wells Fargo, UCSF, Kaiser Permanente
- AI Sector Employment: Growing 25 to 40 percent annually; SF is the undisputed global capital of artificial intelligence
- Vacancy Rate: 5.8% overall; tightening rapidly in AI and tech corridors
The post-pandemic narrative around San Francisco real estate has been significantly more negative than the underlying data justifies. Office vacancy is high, but residential demand from AI workers, returning tech professionals, and international capital is recovering strongly. SF’s 2024 to 2026 window represents the best entry opportunity in a decade.
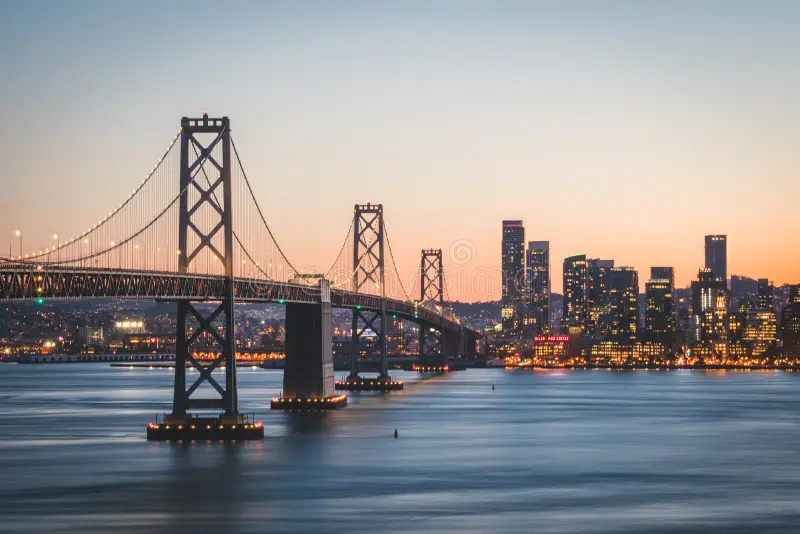
San Francisco’s 7-by-7-mile peninsula creates the most supply-constrained major real estate market in the United States
2026 Economic Outlook
- OpenAI, Anthropic, and Google DeepMind expanding SF headcount rapidly
- UCSF Mission Bay research campus continuing to grow biotech employment
- Salesforce Tower and SoMa office market recovering as AI companies absorb vacated tech space
- SF Central Subway (T Line) improving transit connectivity to Mission Bay and Dogpatch
- Renewed venture capital activity driving startup formation and high-income employee relocation to SF
- Mayor’s housing initiative pushing density and permitting reform to address chronic undersupply
The Post-Pandemic Reset and AI Recovery
SF’s investment narrative has been complicated by a pronounced post-pandemic correction that must be understood clearly by any investor entering the market:
| Period | Market Driver | Avg Annual Appreciation | Key Event |
|---|---|---|---|
| 2010-2019 | Tech boom, IPO wealth, supply constraints | 8-14% | SF becomes world’s most expensive rental market; Uber, Lyft, Airbnb IPOs generate enormous local wealth |
| 2020-2021 | Pandemic dispersal, remote work exodus | -8% to -15% (condos worst) | SF loses 55,000 residents; condo market drops sharply; SFH relatively resilient |
| 2021-2022 | Partial recovery, hybrid work stabilization | 5-12% | SFH prices recover; condo inventory elevated; AI sector hiring begins |
| 2023-2024 | Rate shock, tech layoffs, continued uncertainty | -3% to +4% | Market flat to slightly negative; AI sector emergence begins reversing narrative |
| 2025-2026 | AI boom, rate stabilization, tech return to office | 6-11% (projected) | OpenAI, Anthropic expansion; office attendance recovering; residential market turning |
The investors who will benefit most from San Francisco’s AI recovery are those buying in 2025 to 2026 at prices that still reflect post-pandemic discount. SF’s 10-year compound appreciation through multiple cycles has averaged 7 to 9 percent, making it one of the top-performing major real estate markets in the United States over any 10-year period despite the pronounced cyclical volatility.
Why SF Remains a Compelling Long-Term Hold
- Geographic Permanence: The peninsula cannot grow outward. Every new resident and every new tech company adds demand to a fixed housing supply. This structural imbalance does not resolve; it compounds.
- Highest-Income Renter Pool in the Nation: At $136,000 median household income and 66 percent renters, SF has an extraordinary combination of high willingness to pay and high captive tenant volume.
- AI as the Next Tech Wave: Each major tech wave (web, mobile, social, cloud, AI) has concentrated its highest-value employment in the Bay Area. AI is no exception, and unlike earlier waves, AI specifically prefers dense urban SF over suburban campuses.
- Proposition 13 Compounding: Long-term SF holders benefit from the same Prop 13 assessment lock described in the LA guide, which becomes increasingly valuable as prices appreciate at 7 to 10 percent annually against a 2 percent property tax assessment cap.
- UCSF and Biotech: UCSF’s Mission Bay campus is one of the world’s leading biomedical research centers. Biotech employment in SF is a permanent, non-cyclical demand driver that weathered every tech downturn.
📚 New to real estate investing? Master the fundamentals with our professional course Learn more →
2. Neighborhood Hotspots
San Francisco Investment Neighborhood Map
Interactive map of SF’s key investment neighborhoods. Green stars show top hotspots, blue circles mark established markets, and orange circles highlight emerging areas.
Core Investment Neighborhoods
Detailed Submarket Analysis: All SF Neighborhoods
| Neighborhood | Price Range | Cap Rate | Growth Drivers | Best Strategy |
|---|---|---|---|---|
| Pacific Heights / Cow Hollow | $2M-$8M+ | 2.0-3.0% | Trophy properties, finance elite, Bay views, global buyers | Pure appreciation, trophy hold, international buyers |
| Noe Valley / Castro | $1.5M-$3.5M | 2.8-3.8% | Premium families, micro-climate, walkability, most resilient | Long-term hold, lowest vacancy SF |
| Marina / Cow Hollow | $1.1M-$2.5M | 3.0-4.0% | Young tech, walkability, lifestyle, low vacancy | Tech worker rentals, condo appreciation |
| Inner Sunset / Cole Valley | $1.1M-$2.2M | 3.2-4.2% | UCSF medical, walkability, stable demand | Best risk-adjusted SF investment |
| Dogpatch / Mission Bay | $900K-$1.8M | 3.5-4.5% | OpenAI, Anthropic, UCSF, AI sector, T Line | AI boom play, buy at current discount |
| Potrero Hill | $1.1M-$2.3M | 3.3-4.3% | Views, AI corridor proximity, tech renters | Tech worker hold, Mission Bay overflow |
| Mission District | $1.0M-$2.2M | 3.5-4.8% | Value-add, Victorian stock, tech gentrification | Value-add renovation, multi-family, BRRRR |
| Inner Richmond | $1.0M-$2.0M | 3.5-4.5% | Golden Gate Park, Clement Street, stable tenants | Stable hold, diverse tenant base |
| Outer Sunset | $950K-$1.8M | 4.0-5.0% | Ocean proximity, family/essential worker stability | Best SF yield, affordable entry |
| SOMA / SoMa | $750K-$1.8M | 3.5-5.0% | AI companies moving in, transit, buying opportunity | Buy-the-dip, AI recovery play |
| Excelsior / Outer Mission | $800K-$1.4M | 4.5-6.0% | Affordability, cash flow, Mission gentrification spillover | Best SF cash flow, long-term appreciation |
| Bayview / Hunters Point | $650K-$1.2M | 5.0-7.0% | Lowest SF entry, T Line, long-term appreciation play | Patient appreciation, highest SF cap rate |
Expert Insight: “The story in SF right now is twofold. First, AI is pulling the highest-earning workers in human history back to SF proper, and they want to live in the city, not commute from the suburbs. Second, properties in SoMa and Mission Bay that were trading at 2015 prices a year ago are now recovering quickly as AI companies take over the office space and their employees fill the residential inventory. The window to buy at pandemic-era discounts in these neighborhoods is closing in 2026. Anyone who waited for the bottom and is still waiting has already missed it in Dogpatch.” – Wei Chen, Managing Director, Bay Area Capital Real Estate
3. Property Types
| Investment Goal | Best Property Type | Best Neighborhoods | Minimum Capital |
|---|---|---|---|
| Maximum Appreciation | SFH in premium supply-constrained neighborhoods | Noe Valley, Pacific Heights, Cole Valley | $425,000+ |
| AI Sector Recovery Play | Condo at current discount in AI corridor | Dogpatch, Mission Bay, SoMa | $225,000+ |
| Best Current Yield | Outer Sunset SFH or multi-family | Outer Sunset, Excelsior, Outer Richmond | $250,000+ |
| Best Value-Add | Victorian multi-family with below-market or vacant tenancies | Mission, Inner Sunset, Cole Valley | $380,000+ |
Don’t guess the costs. Our Complete Renovation & Remodeling Cost Guide covers 400+ pages of project-by-project breakdowns with real contractor pricing ranges.
4. Cost Analysis
Acquisition Cost Breakdown (San Francisco)
| Expense Item | Typical Cost | Example ($1.35M Property) | Notes |
|---|---|---|---|
| Down Payment | 25-30% (investment) | $337,500-$405,000 | Jumbo loans essentially universal for SF investment properties |
| SF Transfer Tax | 1.5% (at $1M-$5M) | $20,250 | SF tiered transfer tax; typically split 50/50 buyer/seller by custom, but negotiable |
| Closing Costs (other) | 1.5-2.5% of price | $20,250-$33,750 | Title insurance, escrow, lender fees, recording; California escrow-based closings |
| General Inspection | $600-$1,000 | $750 | Seismic and foundation evaluation especially important for hillside and pre-1940 SF buildings |
| Seismic / Structural Assessment | $800-$3,000 | $1,500 | Soft-story multi-family buildings require SF DBI soft-story retrofit compliance verification |
| Rent Ordinance Status Research | $500-$2,000 | $1,000 | Attorney review of Rent Ordinance status, current legal rents, and any pending petitions |
| Initial Repairs / Make Ready | 0-15% of price | $0-$202,500 | SF Victorian/Edwardian deferred maintenance can be substantial; budget generously |
| Reserves (9 months) | 9 months expenses | $30,000-$45,000 | Larger reserves recommended in SF given eviction process complexity and potential legal costs |
| TOTAL MINIMUM ENTRY (turnkey) | ~30-35% of value | $411,250-$507,750 | Among the highest capital requirements of any U.S. city |
Sample Cash Flow Analysis: Inner Sunset 3BR Single-Family Home
| Item | Monthly | Annual | Notes |
|---|---|---|---|
| Gross Rent (3BR SFH) | $5,200 | $62,400 | Inner Sunset, renovated, UCSF medical professional tenant |
| Less Vacancy (4%) | -$208 | -$2,496 | Inner Sunset SFH vacancy is typically under 3% |
| Property Taxes | -$1,706 | -$20,475 | 1.5% effective rate (SF surcharges add ~0.25% above state base) |
| Insurance | -$300 | -$3,600 | Landlord policy + earthquake insurance; earthquake strongly recommended in SF |
| Property Management (9%) | -$468 | -$5,616 | Strongly recommended; SF Rent Ordinance expertise essential |
| Maintenance + CapEx (7%) | -$364 | -$4,368 | Medical professional tenants have low wear; SF material costs are high |
| Net Operating Income | $2,154 | $25,845 | Before mortgage; cap rate 1.9% at purchase price |
| Mortgage ($1.35M, 25% down, 7.0%, 30yr jumbo) | -$6,750 | -$81,000 | Jumbo investment rate; SF requires very large loan amounts |
| CASH FLOW | -$4,596 | -$55,155 | Significant negative carry; this is standard for SF investment |
| Total Return (9% appreciation) | ~18-22% | Including equity, appreciation, principal paydown on ~$420K invested |
This example shows why SF investment requires extraordinary income or existing capital. A $4,600 monthly negative carry requires the investor to have significant income or liquid reserves to sustain the position during the appreciation period. The total return at 9 percent appreciation is compelling at 18 to 22 percent annually on invested capital, but only investors who can carry the negative cash flow capture it. The multi-family or TIC structures improve these numbers significantly by adding rental income from additional units.
Expert Insight: “The investors who thrive in San Francisco are almost exclusively those with two things: a long time horizon of 10 to 20 years, and income high enough to service the negative carry without stress. In my experience, tech equity compensation from IPOs and secondary sales creates the ideal SF investor profile: someone with $400,000 to $600,000 in liquid capital from stock, a stable $300,000+ household income, and a 15-year hold commitment. The Prop 13 advantage compounds enormously over that timeframe. I have clients who bought $1.2M properties in 2005 that are worth $3.8M today and paying property taxes on a $1.5M assessed value. That gap is a multi-hundred-thousand-dollar annual advantage that no other investment can replicate.” – Sarah Park, Principal, SF Wealth Real Estate Partners
5. Legal Framework
⚠️ Critical Notice: SF Has the Most Tenant-Protective Laws in the United States
San Francisco’s landlord-tenant regulatory environment is more complex and more tenant-protective than any other major U.S. city including New York. The SF Rent Ordinance applies from day one of tenancy (unlike LA’s RSO or California’s AB 1482 which have 12-month thresholds). Just cause eviction is required immediately. Relocation assistance is required for most no-fault evictions. The Ellis Act allows landlords to withdraw rental units from the market, but the requirements and consequences are substantial. SF also has additional local tenant protections beyond state law that the state preemption does not eliminate because they are more protective of tenants, not less. Every SF investment decision must be made with a clear understanding of these requirements. A San Francisco-licensed landlord-tenant attorney is a non-negotiable team member for any SF investor.
San Francisco Rent Ordinance
The SF Rent Ordinance (Administrative Code Chapter 37) applies to residential units in buildings with 2 or more units built before June 13, 1979:
- Annual Rent Increases: Limited to 60 percent of CPI annually. The SF Rent Board sets the allowed increase each year. Recent allowable increases have been 1.4 to 2.3 percent, dramatically below market rent growth. Banked increases (unused prior years) can be applied but are limited.
- Just Cause Eviction from Day One: Unlike state AB 1482 which requires 12 months tenancy before just cause applies, SF’s Rent Ordinance requires just cause for eviction from the very first day of occupancy. This is the most tenant-protective element of SF law and applies to all covered units.
- Owner Move-In Evictions: Allowed under just cause, but the owner must actually move in and occupy the unit for at least 36 months. Relocation assistance of 2 to 6 months rent is required depending on tenant vulnerability status.
- Relative Move-In: Allows eviction to house a qualified relative (spouse, child, parent, grandparent, sibling), subject to relocation assistance requirements.
- Ellis Act: California state law allows landlords to permanently exit the rental housing business by withdrawing all units in a building from the rental market. Requires 120-day notice (one year for elderly or disabled tenants) and payment of relocation assistance. The property cannot be re-rented for 10 years.
- Costa-Hawkins Vacancy Decontrol: When a covered unit becomes vacant, the landlord may set the new rent at market rate. This is the primary value-creation mechanism for buildings with below-market RSO tenants.
Additional SF-Specific Regulations
- SF Transfer Tax: Tiered documentary transfer tax on all real property sales. Key rates: 0.5% (under $250K), 0.68% ($250K-$999,999), 0.75% ($1M-$4.999M wait the actual rate at $1M-$5M is 1.5%), 2.25% ($5M-$9.999M), 3.0% ($10M-$24.999M), 6.0% ($25M+). These are among the highest transfer taxes in the nation.
- Proposition M (2024 Empty Homes Tax): SF voters approved a tax on vacant residential units. Owners of residential units vacant for more than 182 days per year must pay an annual tax of $2,500 to $5,000 per unit. Verifying unit occupancy plan is essential before purchase.
- Soft-Story Retrofit Ordinance: Pre-1978 soft-story apartment buildings (wood-frame with open parking on the ground floor) must complete seismic retrofits by 2018 deadline. Most buildings should be compliant; verify compliance before purchase.
- Short-Term Rentals (Airbnb): SF allows STRs only in owner-occupied primary residences. Investment properties cannot legally operate as STRs. Enforcement is active and fines are substantial.
- Condo Conversion Lottery: SF has a condo conversion lottery with a multi-year waiting list. TIC buildings can apply to convert to condos; conversion dramatically increases individual unit values.
- Earthquake Insurance: Not legally required but strongly recommended in earthquake-prone SF. Annual premium $2,000 to $7,000 depending on construction type and age.
Key Resources
- SF Rent Board: sfrb.org
- SF DBI (Permits): sfdbi.org
- SF Transfer Tax: sfassessor.org
- SF Apartment Association: sfaa.org
| Property Type | Rent Control Status | Max Annual Increase | Just Cause Eviction |
|---|---|---|---|
| Multi-family, pre-June 1979, 2+ units | SF Rent Ordinance applies fully | 60% of CPI (~1.4-2.3%) | Day one of tenancy |
| Multi-family, post-June 1979, 15+ years old | AB 1482 applies (not SF Rent Ord) | 5% + CPI (max 10%) | After 12 months |
| Single-family home (with Costa-Hawkins notice) | SF Rent Ordinance rent rules apply, but eviction rules more flexible | 60% of CPI (if covered building) | Varies; notice requirements apply |
| Condo (individually owned) | Generally exempt from SF Rent Ordinance | AB 1482 cap may apply | After 12 months (AB 1482) |
| New construction (post-2009, under 15 years) | Exempt from Rent Ordinance and AB 1482 | No cap during exemption period | Standard tenant protections only |
6. Step-by-Step San Francisco Investment Playbook
Define Your SF Strategy
AI Sector Recovery Play
Buy condos or newer buildings in SoMa, Dogpatch, or Mission Bay at current post-pandemic discounts before AI worker demand fully absorbs the elevated inventory. This is the most time-sensitive SF opportunity in 2026.
Premium Long-Term Hold
Buy SFH or quality multi-family in Noe Valley, Inner Sunset, or Cole Valley. Accept deep negative carry as the cost of holding one of the world’s most supply-constrained real estate assets. Requires 7 to 15 year horizon and very strong income.
Value-Add Victorian Multi-Family
Acquire a pre-1979 multi-family building with a mix of below-market SF Rent Ordinance tenants and vacant units. Renovate vacant units to market standard. Benefit from vacancy decontrol as long-term tenants eventually turn over. Requires deep SF regulatory expertise.
TIC Acquisition + Condo Conversion
Buy a TIC interest at a 15 to 25 percent discount to equivalent condo pricing. Enter the SF condo conversion lottery or pursue bypass conversion. Convert TIC to condo, capturing the full value gap immediately as a realized gain. SF-specific expertise required.
Build Your San Francisco Team
- SF-Specialist Investment Agent: Must have specific multi-family investment and TIC experience. Ask them to walk through a sample SF Rent Ordinance analysis on a current listing and identify the current legal rents, banked increases, and capital improvement pass-throughs. Inadequate SF knowledge at the agent level is the most common investor mistake.
- SF Landlord-Tenant Attorney: Non-negotiable. SF’s Rent Ordinance is litigated frequently and aggressively. The SF Apartment Association maintains an attorney referral network. Budget $5,000 to $15,000 for annual legal expenses in a managed SF portfolio.
- SF-Licensed Property Manager: Must be a current member of SFAA and able to demonstrate specific Rent Ordinance compliance expertise including annual increase procedures, banked increase calculations, capital improvement petitions, and just cause eviction documentation.
- TIC and Condo Conversion Specialist: If pursuing the TIC strategy, add a real estate attorney with specific TIC conversion and SF condo lottery experience to your team.
- Bay Area Real Estate CPA: California state income tax, SF gross receipts tax, Prop 13 management, and cost segregation on SF multi-family require Bay Area-specific expertise. SF also levies an annual gross receipts tax on rental income above certain thresholds.
Critical Due Diligence Note: Before making any offer on a SF Rent Ordinance-covered building, obtain the current legal rent for every unit in writing from the current owner, verified against the SF Rent Board records. Current legal rents in older SF buildings can be 40 to 70 percent below current market rents. The gap between current legal rent and potential market rent is the most important number in any SF multi-family acquisition analysis.
SF-Specific Due Diligence
Physical Due Diligence
- Seismic evaluation for pre-1940 construction and hillside properties (SF has multiple active fault zones)
- Soft-story retrofit compliance certificate from SF DBI for any multi-family building
- Foundation condition on hillside properties (San Francisco hillsides have significant soil movement risk)
- Dry rot and moisture inspection (SF’s fog belt creates chronic moisture issues in Victorian-era wood construction)
- Electrical panel capacity for EV charging and modern appliance loads in older buildings
- Asbestos and lead paint testing for pre-1978 buildings
- Permit history verification at sfdbi.org; unpermitted work is common in SF
Legal and Regulatory Due Diligence
- Pull current legal rent for every unit from SF Rent Board records at sfrb.org
- Identify any pending Rent Board petitions, capital improvement pass-through orders, or tenant-filed complaints
- Verify building’s condo conversion eligibility and position in lottery queue if relevant
- Check Ellis Act history; buildings that have been Ellis Act evicted cannot be re-rented within 10 years
- Confirm TIC agreement terms and financing if purchasing a TIC interest
- Review all existing leases and any side agreements with current tenants
- Verify SF gross receipts tax implications if annual rental income exceeds applicable thresholds
Navigating SF’s Competitive Market
- All-cash offers still win: SF’s highest-quality investment properties, particularly Victorian multi-family buildings with below-market tenants, regularly receive multiple offers. All-cash with short escrow remains the most competitive position.
- Off-market deals are the real prize: The most valuable SF investment transactions happen off-market. Build relationships with SF multi-family specialists, estate attorneys handling probate properties, and tenant buyout specialists. Properties with long-term below-market tenants are frequently sold off-market specifically to avoid the disclosure complications of a public listing.
- Tenant buyout agreements: In SF, it is legal to negotiate a voluntary buyout agreement with a tenant in exchange for the tenant voluntarily vacating a rent-controlled unit. This allows the unit to reset to market rent (Costa-Hawkins vacancy decontrol). Tenant buyouts are heavily regulated and require SF Rent Board registration; work with an attorney experienced in SF buyout agreements.
- Probate and trust sales: Many of SF’s most valuable Victorian multi-family buildings have been owned by the same families for 40 to 80 years. Probate and trust sales regularly offer favorable pricing because heirs prioritize liquidity over maximizing sale proceeds.
7. Financing Options for San Francisco
| Loan Type | Down Payment | Rate Premium | Best For | SF Note |
|---|---|---|---|---|
| Jumbo Investment Loan | 25-30% | +0.75-1.5% | All SF investment purchases; conforming limit exceeded by nearly all SF properties | Virtually every SF investment property requires a jumbo loan; strong W-2 income essential |
| TIC Financing (Fractional Loan) | 25-35% | +1.0-2.0% | TIC acquisitions; each TIC owner has their own individual loan | SF-specific product; only a handful of lenders offer TIC fractional loans (North Bay Credit Union, etc.) |
| Portfolio / Balance Sheet Loan | 25-35% | +1.0-2.0% | Self-employed investors, multiple properties, non-standard income | Bay Area portfolio lenders (First Republic successor banks, Bridge Bank) understand SF market |
| Multi-Family Commercial Loan (5+ units) | 25-35% | Varies by DSCR | 5+ unit apartment buildings | SF’s low cap rates make DSCR qualification challenging; lenders familiar with below-market SF rents required |
| House Hacking (FHA/Owner-Occupant) | 3.5-10% | Standard | Owner-occupants buying 2-4 unit buildings | FHA limit in SF County is $1,149,825 for 4-unit; limits access in premium SF neighborhoods |
| All-Cash / 1031 Exchange | 100% | N/A | High-net-worth investors, 1031 exchange capital | All-cash is the most competitive offer structure in SF; 1031 exchange capital from California sellers is a common SF buyer profile |
SF Financing Reality: San Francisco’s property prices and investment yields create some of the most challenging financing conditions of any U.S. real estate market. A $1.35M purchase with 25 percent down requires a $1.01M jumbo investment loan. At 7 percent, that is a $6,700 monthly payment on principal and interest alone, against a $5,200 monthly rental income. The math requires either a very large down payment (40 to 50 percent), extraordinary other income to carry the gap, or all-cash deployment from tech equity or prior investment proceeds. This is precisely why SF investment is dominated by tech professionals, finance executives, and 1031 exchange capital rather than conventional real estate investors.
8. Frequently Asked Questions
Knowledge Quiz: San Francisco Real Estate Investment
Open Quiz
5 quick questions on what you just learned about SF investing
1) What is the key difference between SF’s Rent Ordinance just cause eviction requirement and California’s AB 1482?
Answer: A
This is the most critical regulatory distinction in SF versus other California cities. The SF Rent Ordinance requires just cause for eviction from day one of any tenancy in a covered building. California’s AB 1482 statewide law only triggers just cause eviction requirements after 12 months of continuous tenancy. This means there is no “trial period” for landlords in SF Rent Ordinance-covered buildings, making tenant selection even more critical than in other California markets.
2) What is vacancy decontrol and why is it the most important concept in SF multi-family investment?
Answer: C
Vacancy decontrol under the Costa-Hawkins Rental Housing Act is the mechanism that allows landlords to set rent at market rate when a rent-controlled unit voluntarily becomes vacant. This is the foundation of SF multi-family investment economics: buildings with long-term below-market tenants are priced on current income, but carry enormous embedded value that releases as tenants turn over. A unit paying $1,800 per month can reset to $3,800 when the tenant voluntarily leaves.
3) What is a TIC and what is the primary investment advantage of buying one versus a condo in the same building?
Answer: D
A Tenancy in Common (TIC) is an SF-specific ownership structure where each owner holds an undivided interest in a multi-unit building with a unit assignment agreement. TICs trade at 15 to 25 percent below equivalent condo prices because of more complex financing and shared ownership. When a TIC building is selected in the SF condo conversion lottery and converted to condos, the TIC interest converts to a fee-simple condo worth the full condo market price, capturing the entire discount as a gain.
4) What does the guide identify as the primary reason the 2025-2026 period is an attractive SF entry window?
Answer: B
The guide makes a specific case that 2024 to 2026 represents the best SF entry opportunity in a decade because AI sector employment is growing rapidly in SF proper (25 to 40 percent annually), absorbing residential inventory, but prices in SoMa, Dogpatch, and Mission Bay still reflect post-pandemic discounts from 2022 peaks. The guide describes this as a window where early investors capture the full recovery cycle before broader market recognition drives prices back to or above prior highs.
5) What does the SF Rent Ordinance permit as the maximum annual rent increase on a covered unit in 2026?
Answer: C
The SF Rent Ordinance limits annual rent increases to 60 percent of CPI, set each year by the SF Rent Board. In recent years, with CPI varying between 2.5 and 4.5 percent, the allowable SF rent increase has been approximately 1.4 to 2.3 percent per year. This is dramatically lower than California AB 1482’s 5 percent plus CPI cap (maximum 10 percent) and one of the most restrictive rent increase limits in the United States. The SF allowable increase for 2024 was 1.7 percent.
Work With a Local Expert in San Francisco
We are building a verified network of real estate professionals across every market we cover.

About Our Expert Network
We are finalizing partnerships with verified real estate professionals across every market featured on Builds and Buys. Each expert in our SF network is selected for their SF Rent Ordinance expertise, multi-family and TIC investment experience, and deep neighborhood knowledge.
- Proven track record with SF multi-family, TIC, and investment property transactions
- Deep knowledge of SF Rent Ordinance, vacancy decontrol, and condo conversion
- Access to off-market Victorian multi-family and probate opportunities
- Guidance on TIC financing, buyout agreements, and Rent Board compliance
- Full transaction support from offer through close
- SF Rent Ordinance attorney and property management referrals
Services Covered
- Multi-family investment sourcing
- TIC acquisition and conversion strategy
- SF Rent Ordinance compliance
- Vacancy decontrol analysis
- Value-add Victorian renovation
- Buyer representation
- Landlord-tenant attorney referrals
- Jumbo and TIC financing specialists
- Property management referrals
- Insurance and seismic inspection referrals
- 1031 exchange coordination
- Prop 13 and exit planning
Get Connected or Join Our Network
Looking for an SF investment expert? Reach out and we will connect you with the right professional for your target neighborhood and strategy.
Contact us at support@buildsandbuys.com
Find Specialized San Francisco Real Estate Professionals
Ready to Invest in San Francisco?
San Francisco is not for every investor. The entry costs are extreme, the regulatory environment is the most complex in the nation, and the negative cash flow requires extraordinary income to sustain. But for investors who meet those requirements and commit to a long-term horizon, the city offers something no other market can: permanent geographic supply constraints on a 7-by-7-mile peninsula, the world’s highest concentration of artificial intelligence and technology employment, the nation’s highest median household income, and 66 percent of residents who rent because buying is simply beyond reach. The investors who bought during SF’s 2009 lows, its 2012 lows, and now its 2024 post-pandemic lows have been consistently rewarded. The AI boom is pulling the market’s next cycle forward.
Continue Your California Research
California State Guide
See how SF compares to Los Angeles, San Diego, Sacramento, and all California markets.
Step-by-Step Invest
Complete framework for building a real estate investment strategy from scratch.
144-Lesson Course
University-level real estate education covering financing, law, strategy, and management.
For further guidance, explore our State-by-State Investor guides, browse our expert articles, or follow our Step-by-Step Investment Guide.


