Rancho Cucamonga and Ontario Real Estate Investment Guide For 2026
A comprehensive resource for investors looking to capitalize on one of Southern California’s most dynamic, logistics-powered, and family-oriented inland property markets in 2026
Quick answers: Top 5 most searched Rancho Cucamonga and Ontario investment questions ▼
Migration data: Where people are moving from to Rancho Cucamonga and Ontario ▼
In This Guide
Click on any section to navigate directly to that content
1. Rancho Cucamonga and Ontario Market Overview
Market Fundamentals
Rancho Cucamonga and Ontario together form the western gateway of the Inland Empire, offering Southern California investors a compelling combination of quality-of-life suburban living, strong employment infrastructure, and property values that remain well below comparable coastal communities. Rancho Cucamonga consistently ranks among California’s safest and most desirable cities, while Ontario anchors the market’s commercial and logistics core around one of the Southwest’s fastest-growing airports.
Key economic indicators defining this market’s investment case:
- Population: 180,000+ Rancho Cucamonga, 185,000+ Ontario, 4.6M+ Inland Empire metro
- Major Employers: Ontario International Airport, Amazon Air, FedEx Express, Kaiser Permanente, San Bernardino County, Chaffey College, Stater Bros. (HQ), various corporate distribution centers
- Median Household Income: $82,000 (Rancho Cucamonga), $61,000 (Ontario), both above broader IE average
- Rancho Cucamonga Safety: Consistently ranked top 10 safest California cities, driving demand from families relocating from LA and OC
- Ontario Airport Growth: Passenger traffic growing 15-20% annually as airlines add routes; cargo operations expanding rapidly
- Vacancy Rate: Approximately 4-5% for quality rental stock citywide
The dual-city investment area benefits from complementary dynamics: Rancho Cucamonga draws high-income families seeking suburban quality at inland prices, while Ontario captures the workforce and logistics employee base that cannot afford Rancho Cucamonga’s premium. Together they form a complete rental market ecosystem serving a wide income range with differentiated investment strategies.
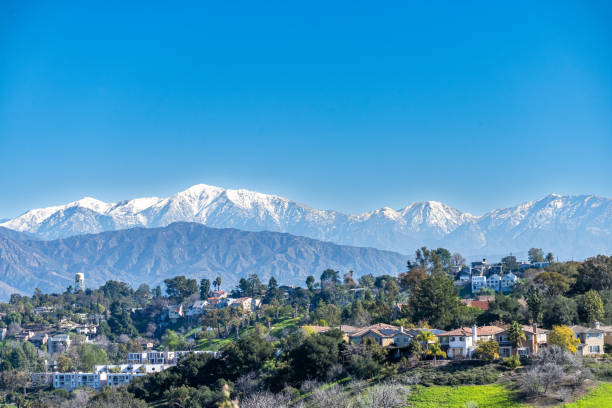
The San Gabriel Mountain backdrop defines Rancho Cucamonga’s identity as Southern California’s most livable inland suburb
2026 Economic Outlook
- Ontario International Airport terminal expansion adding passenger capacity and new airline routes
- Amazon Air hub at ONT expanding cargo volumes and associated employment
- Brightline West high-speed rail (Las Vegas corridor) planning increasing ONT-area transit value
- Chaffey College enrollment and workforce training programs supporting skilled worker pipeline
- Kaiser Permanente and healthcare sector expansion adding stable employment
- Rancho Cucamonga’s Victoria Gardens area adding retail and mixed-use development
Investment Climate
This market sits in the sweet spot of the Inland Empire investment spectrum: better quality and appreciation than San Bernardino, better cash flow than Orange County or LA. The investor profile that succeeds here typically has these characteristics:
- Family rental expertise understanding that 3-4 bedroom single-family homes in Rancho Cucamonga attract long-tenured families who maintain properties well and renew leases consistently
- Airport proximity awareness identifying which Ontario corridors benefit most from airport employment expansion
- AB 1482 compliance discipline maintaining proper exemption notices for SFH rentals and accurately calculating rent increase limits annually
- Long hold strategy planning for 7-10+ year ownership periods to capture the full appreciation cycle driven by airport expansion and continued LA-area migration
- Quality positioning targeting the upper tier of each neighborhood’s rental market rather than competing in the workforce housing segment where management intensity is higher
Historical Performance
| Period | Market Driver | Avg Annual Appreciation | Key Event |
|---|---|---|---|
| 2012-2016 | Post-recession recovery, early logistics expansion | 5-8% | Ontario Airport transferred to local control; logistics boom begins |
| 2017-2019 | LA-area spillover migration, airport growth | 8-12% | OC and LA families discover Rancho Cucamonga value; rents rise |
| 2020-2022 | Pandemic remote work, e-commerce surge, migration spike | 18-25% | Inventory at historic lows; multiple-offer situations standard |
| 2023-2024 | Rate shock, price normalization | 2-4% | Inventory rose modestly; fundamentals remained strong |
| 2025-2026 | Rate stabilization, airport expansion, continued migration | 5-8% (projected) | ONT expansion catalyzes employment and housing demand |
Demographic Trends Driving Demand
- LA and OC Family Migration – Families earning good incomes but priced out of homeownership in coastal markets continue relocating, many renting for 2-5 years before buying
- Airport Employment Growth – Ontario International Airport is expanding at a pace that makes it one of Southern California’s largest employment catalysts, with aviation, logistics, and support services all growing
- Chaffey College – 25,000+ students creating a secondary rental market in the northern Ontario and Rancho Cucamonga corridors
- Healthcare Expansion – Kaiser Permanente, Dignity Health, and related medical employers bring stable, well-paid professionals who form the backbone of the premium rental market
- Asian-American Community – Significant and growing population of high-income Asian-American families specifically targeting Rancho Cucamonga for school quality, driving premium SFH rental demand
- Logistics Management Class – Warehouse and distribution managers earning $80,000-$140,000 per year typically rent in Rancho Cucamonga while waiting to buy, creating a steady professional tenant pipeline
📚 New to real estate investing? Master the fundamentals with our professional course Learn more →
2. Neighborhood Hotspots
Rancho Cucamonga and Ontario Investment Neighborhood Map
Interactive map of investment neighborhoods across Rancho Cucamonga and Ontario. Green stars show top hotspots, blue circles mark established markets, and orange circles highlight emerging areas.
Core Investment Neighborhoods
Detailed Submarket Analysis
| Neighborhood | Price Range (SFH) | Cap Rate | Growth Drivers | Best Strategy |
|---|---|---|---|---|
| Etiwanda (RC) | $680K-$950K | 4.2-5.2% | Top schools, safety, family demand, mountain proximity | Premium family buy-and-hold, long-term appreciation |
| Alta Loma (RC) | $650K-$900K | 4.0-5.0% | Space, privacy, foothills identity, affluent tenants | Estate SFH hold, affluent tenant focus, low turnover |
| Victoria / Central RC | $580K-$800K | 4.5-5.5% | Victoria Gardens, Metrolink, retail employment, walkability | Balanced returns, SFH and condo, commuter tenants |
| Airport Corridor (Ontario) | $520K-$720K | 5.2-6.5% | ONT expansion, aviation jobs, logistics management | Best cash flow, airport professional tenants |
| Haven / South Ontario | $540K-$750K | 5.0-6.0% | Corporate offices, retail, professional tenants, newer communities | Professional SFH rental, dual-income family focus |
| North Ontario / Chaffey | $480K-$660K | 5.2-6.5% | College enrollment, workforce demand, more affordable entry | Workforce housing, duplex opportunities, diversified tenant mix |
| Ontario Ranch (New) | $600K-$800K | 4.5-5.5% | New construction, master-planned, young families | New construction hold, low maintenance, appreciation play |
| Downtown Ontario | $420K-$620K | 5.5-7.0% | Revitalization, transit, mixed-use development, arts | Early-stage value-add, patient capital, revitalization upside |
| Upland (Adjacent) | $560K-$780K | 4.8-5.8% | Downtown charm, schools, Metrolink, relative affordability | Family SFH, value play relative to RC, stable market |
| Eastvale (Adjacent) | $700K-$950K | 4.0-5.0% | New construction, top schools, young families, strong appreciation | New construction appreciation, premium family tenants |
Expert Insight: “The most overlooked opportunity in this market right now is the Ontario Airport Corridor. Investors focus on Rancho Cucamonga for safety and tenant quality but miss the fact that aviation professionals, airline crew, and logistics managers commanding $80,000-$130,000 salaries need rental housing near Ontario International Airport. These tenants are stable, pay on time, and maintain properties well. Properties within 5 miles of ONT are trading at 15-20% below equivalent Rancho Cucamonga properties while delivering meaningfully better cap rates. The airport expansion is going to close that gap significantly over the next 5-7 years.” – Anthony Reyes, Director, Inland Empire Capital Partners
3. Property Types
| Investment Goal | Best Property Type | Best Neighborhoods | Minimum Capital |
|---|---|---|---|
| Best Appreciation | Family SFH in premium submarket | Etiwanda, Alta Loma, Eastvale | $175,000+ |
| Best Cash Flow | Airport Corridor SFH or Ontario duplex | Airport Corridor, North Ontario, Downtown | $130,000+ |
| Balanced Returns | Victoria SFH or Haven Corridor SFH | Victoria, Haven Corridor, South Ontario | $145,000+ |
| Lowest Management | New construction or condo | Ontario Ranch, Eastvale, Victoria condos | $110,000+ |
Don’t guess the costs. Our Complete Renovation & Remodeling Cost Guide covers 400+ pages of project-by-project breakdowns with real contractor pricing ranges.
4. Cost Analysis
Acquisition Cost Breakdown (Rancho Cucamonga / Ontario)
| Expense Item | Typical Cost | Example ($640,000 Property) | Notes |
|---|---|---|---|
| Down Payment | 25% (investment) | $160,000 | Standard for investment properties in California |
| Closing Costs | 2-3% of price | $12,800-$19,200 | Title, escrow, lender fees, recording, California transfer tax |
| General Inspection | $400-$650 | $525 | Check HVAC, roofing, pool if applicable. IE summers demand functional AC. |
| HOA Review (if applicable) | $200-$500 | $350 | Many RC communities have HOAs. Confirm rental permissions and any caps. |
| Initial Repairs / Cosmetics | 0-5% of price | $0-$32,000 | Newer RC stock often move-in ready. Older Ontario homes may need updating. |
| Reserves (6 months) | 6 months expenses | $16,000-$22,000 | Essential given California eviction timelines. Higher reserves recommended for first investment. |
| TOTAL MINIMUM ENTRY | ~30-35% of value | $189,675-$233,875 | Meaningful capital required but still accessible compared to coastal CA markets |
Sample Cash Flow Analysis: Victoria Area 4-Bedroom SFH, Rancho Cucamonga
| Item | Monthly | Annual | Notes |
|---|---|---|---|
| Monthly Rent (4BR SFH) | $3,100 | $37,200 | 4-bedroom, Victoria area, updated kitchen and baths |
| Less Vacancy (5%) | -$155 | -$1,860 | Conservative; family tenants in RC average 3+ year tenancies |
| Property Taxes | -$587 | -$7,040 | ~1.1% of $640K assessed value (Prop 13 base + local bonds) |
| HOA Fees | -$200 | -$2,400 | Common in planned RC communities; verify before purchase |
| Insurance | -$145 | -$1,740 | Landlord policy; wildfire zone surcharges may apply in foothill areas |
| Property Management (9%) | -$266 | -$3,193 | Recommended for AB 1482 compliance; lower rate reflects quality tenants |
| Maintenance + CapEx (7%) | -$203 | -$2,436 | Lower for newer RC stock; higher for older Ontario properties |
| Net Operating Income | $1,544 | $18,531 | Before mortgage |
| Mortgage ($640K, 25% down, 6.75%, 30yr) | -$3,117 | -$37,406 | $480,000 loan balance. May require jumbo financing above $806,500. |
| CASH FLOW | -$1,573 | -$18,875 | Negative but manageable. Dramatically better than LA or OC equivalents. |
| Cap Rate | 2.90% | NOI / Property Value. Reflects premium submarket positioning. | |
| Total Return (7% appreciation) | ~19-22% | Including appreciation, equity paydown, and managed negative carry |
This Rancho Cucamonga example shows the tradeoff inherent in the premium submarket: better tenant quality, lower turnover, and stronger appreciation come at the cost of higher negative carry than Ontario or San Bernardino. The $1,573/month negative carry must be funded from other income, which is why most successful RC investors have strong primary employment income or an existing investment portfolio generating cash. Investors who cannot comfortably absorb this carry should consider the Ontario Airport Corridor, which narrows the gap significantly.
Alternative: Ontario Airport Corridor SFH, Better Cash Flow Profile
| Item | Monthly | Annual |
|---|---|---|
| Rent (3BR, Ontario Airport area) | $2,750 | $33,000 |
| All Expenses (taxes, insurance, mgmt, maintenance, vacancy) | -$1,320 | -$15,840 |
| NOI | $1,430 | $17,160 |
| Mortgage ($580K purchase, 25% down, 6.75%) | -$2,824 | -$33,888 |
| CASH FLOW | -$1,394 | -$16,728 |
| Cap Rate | 2.96% |
The Airport Corridor offers similar negative carry to Rancho Cucamonga despite lower purchase price because rents are also proportionally lower. The advantage emerges over time: the airport expansion story should drive faster rent growth and appreciation in this corridor over the next 5-7 years, potentially making it the better long-term play.
Expert Insight: “Investors who focus only on current cash flow miss the Rancho Cucamonga story entirely. A family that signs a 4-year lease at $3,100/month in Etiwanda and renews twice effectively gives you 8 years of stable income with minimal vacancy or leasing cost. Over that same period, the property appreciates 40-60% based on historical performance. The total return calculation is very attractive even with negative monthly carry, especially when you compare it to the alternative of leaving capital in securities.” – Patricia Chen, Senior Advisor, Pacific West Investment Properties
5. Legal Framework
⚠️ California Landlord Compliance Notice
California’s statewide tenant protection laws apply fully in Rancho Cucamonga and Ontario. Neither city has added a local rent control ordinance on top of state law (AB 1482), making the regulatory environment more straightforward than LA or Oakland. However, statewide protections are extensive and frequently updated. Always consult a California-licensed real estate attorney before acquiring rental properties, and ensure your property management company has documented AB 1482 compliance procedures.
California Statewide Regulations
- AB 1482 Rent Cap: Annual increases capped at 5% + local CPI, maximum 10% regardless of CPI. Applies to most units built before 2010. SFH owned by individual landlords with proper exemption notice and new construction (15 years or newer) are generally exempt.
- AB 1482 Just Cause Eviction: Covered units require enumerated cause for any termination of tenancy. Grounds include non-payment, nuisance, criminal activity, owner move-in, and substantial remodel. Lease expiration alone is not sufficient cause.
- AB 12 Security Deposit Limit (2024): Security deposits now capped at 1 month’s rent for most unfurnished residential units. Significantly reduces upfront protection from problem tenants; strong screening is essential.
- 3-Day Notice: Non-payment requires a 3-day notice to pay or quit before filing unlawful detainer action.
- 90-Day Notice for Large Increases: Rent increases exceeding 10% within a 12-month period require 90 days notice for tenants with 12+ months of occupancy.
- Proposition 13: Property taxes capped at 1% of assessed value (at purchase) with annual increases limited to 2% or inflation. San Bernardino County local bond measures bring effective rate to approximately 1.1-1.2% in Rancho Cucamonga and Ontario.
- Wildfire Zone Insurance: Alta Loma and foothill areas of Rancho Cucamonga may fall in moderate or high wildfire hazard zones under California FHSZ maps, affecting insurance availability and cost. Verify before purchasing.
Local City Considerations
Key local factors for Rancho Cucamonga and Ontario investors:
- No Local Rent Control: Neither Rancho Cucamonga nor Ontario has enacted local rent control ordinances beyond AB 1482. This is a meaningful advantage over investing in LA, Oakland, or San Jose.
- HOA Governance: Many Rancho Cucamonga planned communities have homeowners associations with CC&Rs that may restrict rentals, require HOA approval of tenants, or limit total rentals in a development. Review CC&Rs thoroughly before purchasing any HOA-governed property.
- Permit Requirements: Both cities require permits for significant renovations. ADU permits are processed through San Bernardino County in unincorporated areas or through each city’s development department for incorporated zones.
- Airport Noise Zones: Ontario Airport’s expansion means some properties near ONT fall within aircraft noise contours. Verify noise zone designation and any deed restrictions before purchasing airport-adjacent properties.
- Business License: Both cities require rental property owners to obtain a business license for residential rentals. Annual renewal required.
Useful Resources
- City of Rancho Cucamonga: cityofrc.us
- City of Ontario: ontarioca.gov
- California Apartment Association: caanet.org
- San Bernardino County Assessor: assessor.sbcounty.gov
- CA FHSZ Wildfire Map: osfm.fire.ca.gov/fhsz
| Regulation | RC / Ontario Requirement | Exemptions | Investor Impact |
|---|---|---|---|
| Rent Increases | AB 1482: 5% + CPI, max 10% | SFH individual owners (with notice), new construction 15 yrs+ | Annual increases require CPI data and precise calculation |
| Just Cause Eviction | Required for covered units | Exempt SFHs, new construction, owner-occupied 2-4 unit | Documentation from day one essential; cannot evict at lease end |
| Security Deposit | 1 month maximum (AB 12) | Small landlord exceptions may apply in limited cases | Reduces financial buffer; rigorous tenant screening essential |
| Local Rent Control | None (AB 1482 statewide only) | N/A | Significant advantage over LA and Oakland investors |
| HOA Rental Restrictions | Varies by community CC&Rs | Detached SFH without HOA has no restriction | Must verify before purchase; some HOAs severely limit rental rights |
| Wildfire Insurance | May be required for foothill properties | Flat Ontario properties typically unaffected | Alta Loma / foothills properties may face insurance surcharges or coverage gaps |
6. Step-by-Step Rancho Cucamonga and Ontario Investment Playbook
Choose Your Market Position: RC Premium vs Ontario Value
The first decision is which half of the combined market you are targeting. Both are excellent but suit different investor profiles:
Rancho Cucamonga Premium Strategy
Target Etiwanda, Alta Loma, or Victoria. Accept higher negative carry in exchange for superior tenant quality, lower turnover, and stronger long-term appreciation. Best for investors with strong primary income who can comfortably fund the monthly gap.
Ontario Cash Flow Strategy
Target Airport Corridor or Haven Avenue. Lower entry price, better yield, and the airport expansion story provides a clear catalyst for appreciation. Monthly carry is significantly reduced. Suitable for investors who need their investment to be more self-funding.
ADU Development Play
Buy a SFH in Alta Loma or North Ontario on a lot eligible for ADU. Build DADU over 12-18 months. Add $1,000-$1,400/month rental income and $180,000-$260,000 in property value. Dramatically improves both cash flow and equity position.
New Construction Hold
Purchase new construction in Ontario Ranch or Eastvale at developer pricing. Minimal maintenance for first 5-7 years, builder warranty coverage, and appreciation driven by community maturation. Best for low-management investors with a 10+ year horizon.
Build Your Rancho Cucamonga / Ontario Team
Your team determines your outcome as much as your property selection. Non-negotiable members:
- Inland Empire Investor Agent: Must understand the pricing differential between Rancho Cucamonga, Ontario, and Fontana, and know how to underwrite HOA rental restrictions before you fall in love with a property. Ask specifically about their experience with investment properties in each submarket.
- California Real Estate Attorney: For LLC structuring, AB 1482 exemption notices, and lease template review. Essential before your first purchase.
- Property Manager with IE Track Record: Member of California Apartment Association with documented experience managing both family SFH in RC and airport-adjacent properties in Ontario. Rates vary: expect 8-10% for SFH, 7-9% for multifamily.
- Wildfire Insurance Specialist: For foothill properties, verify insurance coverage well before close. Some standard carriers are withdrawing from California wildfire zones and you need a specialty broker for properties in Alta Loma and higher-elevation areas.
- California CPA: Proposition 13 implications, depreciation strategy, and HOA fee deductibility are all California-specific. Do not use a generic real estate CPA unfamiliar with California’s unique framework.
Expert Tip: For Rancho Cucamonga HOA properties specifically, ask your attorney to review the CC&Rs before making an offer and confirm: (1) no rental cap that restricts the percentage of units that can be rented, (2) no HOA board approval required for tenants, and (3) no rental waiting list or moratorium in effect. These issues are common in RC planned communities and can significantly impair your rental rights if not discovered pre-close.
Market-Specific Due Diligence
Physical Due Diligence
- HVAC full inspection mandatory: IE summers reach 110-115°F and functional central air is a habitability requirement
- Pool inspection if applicable: Very common in RC and Ontario; significant liability and ongoing cost if not maintained
- Wildfire hazard zone verification for Alta Loma and foothill properties
- Airport noise zone confirmation for Ontario properties near ONT
- HOA reserves review: Underfunded HOA reserves signal future special assessment risk
- Sewer and roof condition for any property over 20 years old
- Electrical panel capacity for modern tenant load requirements
Regulatory Due Diligence
- HOA CC&R review for rental restrictions, pet policies, and tenant approval requirements
- AB 1482 coverage status for occupied investment properties: confirm current rent, last increase date, and whether exemption notice has been served
- Business license status: both RC and Ontario require registration for residential rentals
- ADU eligibility confirmation for the specific parcel if ADU strategy is planned
- Ontario Airport noise overlay check for airport-adjacent properties
- Permit history verification for any significant improvements or additions
Tenant Acquisition and Long-Term Management
The Rancho Cucamonga market has a distinct tenant profile that rewards patient, quality-focused landlords. Key management priorities:
Targeting the Right Tenant Profile
For Rancho Cucamonga premium properties, the ideal tenant profile is a dual-income family earning $120,000-$180,000+ annually, currently renting because they cannot yet qualify for a mortgage in this market or are waiting out the rate environment. These tenants:
- Treat the property as their home and maintain it accordingly
- Pay on time because their income-to-rent ratio is strong
- Typically renew 2-4 times before purchasing or moving markets
- Are reachable through LinkedIn, corporate relocation programs, and employer housing assistance programs at major Inland Empire employers
Annual AB 1482 Rent Management
For properties not exempt from AB 1482, the annual rent increase process requires:
- Obtain current-year Riverside-San Bernardino-Ontario CPI data from Bureau of Labor Statistics
- Calculate allowable increase (5% + CPI, capped at 10%)
- Issue proper written notice (30 days for increases under 10%, 90 days for increases over 10%)
- Document calculation with dated records in tenant file
For AB 1482-exempt SFH properties: ensure exemption notice was properly served at or before lease commencement, and serve again with any renewal or new tenancy.
7. Financing Options for Rancho Cucamonga and Ontario
| Loan Type | Down Payment | Rate Premium | Best For | RC / Ontario Note |
|---|---|---|---|---|
| Conventional Conforming | 25% | +0.5-0.75% | Properties under $806,500, strong W-2 income | Many Ontario properties qualify; some RC properties are just under the limit |
| Jumbo Investment | 25-30% | +0.75-1.25% | Etiwanda and Alta Loma properties above conforming limit | Required for most premium Rancho Cucamonga purchases above $807K |
| FHA (House Hack) | 3.5% | Standard + MIP | Owner-occupying one unit of 2-4 unit property | Strong entry strategy for duplexes in North Ontario; RC has limited duplex stock |
| DSCR Loan | 25-30% | +1.5-2.5% | Self-employed investors, no income verification preferred | Challenging: most RC and Ontario SFH don’t cover debt service at 1.0x DSCR at current rates. Airport Corridor may qualify. |
| Portfolio Loan | 20-30% | +1-2% | Multiple properties, LLC ownership, self-employed | Inland Empire community banks and credit unions; useful for scaling beyond 4 properties |
| ADU / Construction Loan | 20-25% | +1-2% | Post-purchase ADU development financing | HELOC on existing equity is often the most efficient RC/Ontario ADU financing path |
| Hard Money / Bridge | 15-25% | 9-13% rate | Downtown Ontario value-add rehab acquisitions | IE hard money lenders active; plan 9-12 month bridge period for downtown rehabs |
Financing Reality Check: The critical difference between Rancho Cucamonga and Ontario for financing is the conforming loan limit. Ontario’s lower price points mean many properties can be financed with standard conforming loans, avoiding the jumbo premium. Rancho Cucamonga’s higher prices, particularly in Etiwanda, frequently push into jumbo territory. Investors whose W-2 income qualifies for conforming products should strongly consider Ontario properties first if the conforming limit is a constraint, then refinance into portfolio products as the portfolio grows.
8. Frequently Asked Questions
Knowledge Quiz: Rancho Cucamonga and Ontario Real Estate Investment
Open Quiz
5 quick questions on what you just learned about Rancho Cucamonga and Ontario investing
1) What is the primary HOA due diligence risk specific to Rancho Cucamonga planned communities?
Answer: C
The guide identifies rental caps as the primary HOA risk. Many RC planned communities restrict what percentage of units can be rented simultaneously. If that cap is hit, a new landlord may not be able to rent their unit at all until another owner stops renting. This must be verified before making any offer on an HOA property.
2) Why is Ontario International Airport’s expansion important for real estate investors in this market?
Answer: B
The guide identifies ONT expansion as a multi-decade employment growth story. Amazon Air, FedEx Express, UPS, and new airline routes are all bringing jobs whose employees need housing near the airport. Properties in the Airport Corridor have consistently outperformed broader IE appreciation benchmarks as a result.
3) Which Rancho Cucamonga submarket does the guide identify as best for family rentals with the lowest tenant turnover?
Answer: A
Etiwanda is Rancho Cucamonga’s most desirable family submarket, with top-rated Etiwanda School District schools, low crime, newer housing stock, and mountain views. The guide notes that family tenants in this area average 3+ year tenancies, dramatically reducing vacancy and leasing costs compared to other submarkets.
4) What unique wildfire insurance challenge exists for Alta Loma and foothill Rancho Cucamonga properties?
Answer: D
The guide warns that State Farm, Allstate, Farmers, and other major carriers have withdrawn from California wildfire zones. Alta Loma and foothill RC properties in High or Very High FHSZ designations may require specialty insurance brokers or California FAIR Plan coverage. Investors must verify insurance availability before making an offer, not after entering escrow.
5) The guide recommends that most first-time Inland Empire investors start with Ontario rather than Rancho Cucamonga. What is the primary reason?
Answer: B
The guide recommends Ontario as a first investment because lower price points mean lower financial stakes while learning California’s regulatory environment, HOA complexity is less common in Ontario than RC’s planned communities, and the airport expansion provides a clear investment thesis. Many IE investors start in Ontario and scale into Rancho Cucamonga using equity from their first property.
Work With a Local Expert in Rancho Cucamonga and Ontario
We are building a verified network of real estate professionals across every market we cover.

About Our Expert Network
We are finalizing partnerships with verified real estate professionals across every market featured on Builds and Buys. Each expert in our network is selected for their hands-on investment experience, local market knowledge, and commitment to helping buyers and investors make sound decisions.
Our local specialists offer:
- Proven experience with investment and income-producing properties
- Deep knowledge of local pricing, rental yields, and neighborhood dynamics
- Guidance on financing, legal structure, and due diligence
- Access to off-market and pre-market opportunities
- Full transaction support from search through closing
- Ongoing portfolio and property management referrals
Services Covered
- Property sourcing and acquisition
- Investment analysis and underwriting
- Buyer representation
- Market comparables and valuations
- Short-term and long-term rental strategy
- Value-add and renovation guidance
- Legal and title referrals
- Financing and lender connections
- Property management referrals
- Insurance and inspection referrals
- 1031 exchange coordination
- Exit strategy planning
Get Connected or Join Our Network
Looking for a local expert to help with your investment? Reach out and we will connect you with the right professional for your market and strategy.
Are you a real estate professional with a track record working with investors? We are always expanding our network of verified local experts.
Contact us at support@buildsandbuys.com
Find Specialized Real Estate Professionals in Rancho Cucamonga and Ontario
Ready to Invest in Rancho Cucamonga and Ontario?
The Rancho Cucamonga and Ontario market offers something rare in Southern California: a credible path to long-term wealth building through real estate that does not require accepting LA-level negative carry or OC-level entry prices. Rancho Cucamonga’s reputation as California’s safest and most family-friendly inland suburb continues to attract LA and OC migration that shows no signs of slowing. Ontario’s airport expansion is a multi-decade employment story that is still in its early chapters. Together, these two cities give investors a choice between premium appreciation with quality tenants on one end, and better cash flow with a powerful infrastructure growth catalyst on the other. Both are compelling. The right choice depends on your capital, income, and investment style, but either direction leads to a fundamentally sound long-term California real estate position.
Continue Your Research
California State Guide
See how this market compares to San Diego, Sacramento, LA, and other California markets.
San Bernardino Guide
Compare this market against San Bernardino’s higher yields and lower entry prices.
144-Lesson Course
University-level real estate education covering financing, law, strategy, and management.
For further guidance, explore our State-by-State Investor guides, browse our expert articles, or follow our Step-by-Step Investment Guide.


