Reno Real Estate Investment Guide For 2026
A comprehensive resource for investors targeting Nevada’s northern tech hub, where Tesla, Apple, and Google have transformed the Biggest Little City into one of America’s most compelling technology-driven real estate markets
Quick answers: Top 5 most searched Reno investment questions ▼
Migration data: Where people are moving from to Reno ▼
In This Guide
Click on any section to navigate directly to that content
1. Reno Market Overview
Market Fundamentals
Reno is Nevada’s technology transformation story. Once synonymous with gaming, divorce tourism, and cheap entertainment, the Biggest Little City has reinvented itself as a genuine technology and innovation hub over the past decade. Tesla’s decision to build its first Gigafactory in Storey County, 15 miles east of Reno, triggered a cascade of tech and industrial investment that has fundamentally restructured the metro’s economy and housing market. For real estate investors, Reno now offers something rare: technology-driven appreciation at a fraction of San Francisco or Seattle prices, paired with Nevada’s zero income tax and landlord-friendly law.
Key economic indicators defining Reno’s investment case:
- Population: 275,000+ city proper; 500,000+ Reno-Sparks metro and growing
- Major Employers: Tesla Gigafactory, Switch, Apple, Google, Amazon, Panasonic, University of Nevada Reno, Renown Health, Washoe County School District
- Median Household Income: $68,000 city; $75,000 to $95,000 in South Reno and tech corridors
- Job Growth: 3.8% annually, among the highest of any mid-size U.S. metro
- No State Income Tax: Bay Area tech workers save $20,000 to $50,000 annually relocating to Reno
- Geographic Constraints: Sierra Nevada to the west, Peavine Mountain to the north, and desert ranges to the east limit developable land, supporting long-term values
Reno’s investment thesis is fundamentally different from Las Vegas. Where Las Vegas is driven by tourism, migration affordability, and logistics, Reno is driven by a concentrated technology employer base creating high-income jobs, a university anchoring consistent rental demand, and geographic supply constraints that structurally support appreciation. It is closer to a smaller version of the Seattle investment story than a Nevada gaming market story.
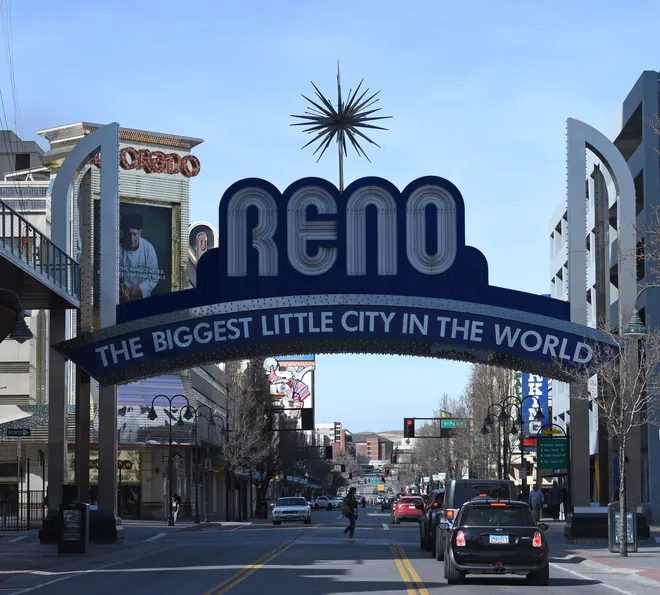
Reno’s transformation from gaming hub to tech corridor has created one of the most compelling mid-size city investment markets in the American West
2026 Economic Outlook
- Tesla Gigafactory continuing production ramp-up with Panasonic battery manufacturing expansion
- Switch data center campus expanding with new hyperscale facilities
- University of Nevada Reno medical school expansion adding healthcare employment
- Reno-Tahoe International Airport capacity expansion supporting population and business growth
- Downtown Reno revitalization continuing with new residential, hotel, and entertainment development
- Truckee Meadows continued California migration as Bay Area housing costs remain prohibitive
Investment Climate
Reno sits at an interesting mid-point between a cash flow market and an appreciation market. Cap rates of 4.5 to 6 percent in most submarkets mean cash flow is tighter than North Las Vegas but significantly better than Seattle or San Francisco. The tech employment base creates a tenant profile closer to Seattle’s high-income professional demographic, which means lower vacancy, stronger rent growth, and better property care than tourism-dependent markets.
- Tech-driven tenant quality with Tesla, Switch, and university employees creating a stable, high-income rental base with low vacancy and consistent rent growth
- Geographic constraints from the Sierra Nevada, Peavine Mountain, and surrounding ranges limiting new development and supporting long-term appreciation
- California proximity advantage positioning Reno as the closest affordable alternative to the Bay Area for remote workers and relocating tech employees
- Four seasons appeal with Lake Tahoe skiing, fishing, and outdoor recreation creating lifestyle demand that drives long-term population retention
- Diversification from gaming reducing the recession sensitivity that made historical Reno a higher-risk investment market before the tech transformation
Historical Performance
| Period | Market Driver | Avg Annual Appreciation | Key Event |
|---|---|---|---|
| 2013-2016 | Post-recession recovery, Tesla Gigafactory announcement | 8-13% | Tesla Gigafactory announced 2014; California migration begins accelerating |
| 2017-2019 | Tesla production, tech company arrivals, California migration | 11-15% | Switch and Apple data centers open; Reno named among fastest appreciating U.S. cities |
| 2020-2022 | Remote work, pandemic migration, continued tech expansion | 17-28% | Pandemic remote work supercharged California-to-Reno migration; inventory collapsed |
| 2023-2024 | Rate normalization, market correction | 3-7% | Prices corrected modestly from pandemic highs; rents held due to continued job growth |
| 2025-2026 | Rate stabilization, sustained tech growth | 8-11% (projected) | Panasonic Gigafactory expansion; continued California migration; Switch expansion |
Reno has delivered average annual appreciation of 9 to 11 percent over the past decade, placing it among the top-performing mid-size cities in the United States. A $300,000 Reno property purchased in 2014 would be worth approximately $750,000 to $850,000 today. The 2008 financial crisis hit Reno hard as it did Las Vegas, but the post-Tesla transformation has fundamentally changed the market’s economic driver, making it meaningfully more resilient than the pre-2014 gaming-dependent era.
Demographic Trends Driving Demand
- Bay Area Tech Migration – Software engineers, data scientists, and tech professionals earning San Francisco salaries relocating to Reno for housing affordability and zero income tax; many work remotely or at Reno-based tech employers
- Tesla and Gigafactory Ecosystem – 10,000+ direct Tesla employees plus thousands more in the supplier and logistics ecosystem surrounding the Gigafactory, creating premium and workforce rental demand throughout the metro
- University of Nevada Community – 21,000+ students, 2,000+ faculty and staff, and a growing medical school creating stable, year-round rental demand in Northwest Reno
- Outdoor Recreation Lifestyle – Proximity to Lake Tahoe skiing, Truckee River fishing, and dozens of outdoor recreation opportunities creates lifestyle demand that retains population and attracts long-term residents
- Healthcare Sector Growth – Renown Health system expansion and UNR medical school growth adding hundreds of high-income healthcare professional jobs annually
- Retiree Inflow – Nevada’s tax environment and Reno’s four-seasons climate attract retirees from California, Oregon, and Washington seeking lifestyle at lower cost
📚 New to real estate investing? Master the fundamentals with our professional course Learn more →
2. Neighborhood Hotspots
Reno Investment Neighborhood Map
Interactive map of Reno’s investment neighborhoods. Green stars show top hotspots, blue circles mark established markets, and orange circles highlight emerging areas.
Core Investment Neighborhoods
Detailed Submarket Analysis: All Reno Metro Neighborhoods
| Neighborhood | Price Range (SFH) | Cap Rate | Growth Drivers | Best Strategy |
|---|---|---|---|---|
| South Reno | $500K-$900K | 4.0-5.0% | Tech executives, top schools, master-planned, Tahoe proximity | Long-term appreciation, executive rentals |
| Midtown Reno | $375K-$600K | 4.5-5.5% | Urban revival, walkability, young professionals, strongest rent growth | Value-add, urban appreciation, millennial demand |
| Northwest Reno / University | $450K-$700K | 4.5-5.5% | UNR, medical district, established neighborhoods, academic year demand | Student housing, academic professional rentals |
| Sparks | $400K-$520K | 5.0-6.0% | Tesla proximity, logistics, more affordable than Reno, family demographics | Balanced returns, Tesla workforce, cash flow focus |
| Spanish Springs | $425K-$600K | 4.8-5.8% | Master-planned, family demographics, newer housing, Sparks proximity | Family buy-and-hold, new construction |
| Southwest Reno / Damonte Ranch | $450K-$650K | 4.5-5.5% | Master-planned, schools, family demographics, South Reno alternative | Family rentals, balanced returns |
| North Reno / North Valleys | $350K-$480K | 5.5-6.5% | Affordability, workforce housing, improving amenities, Reno spillover | Best Reno cash flow, workforce housing |
| Old Southwest Reno | $400K-$600K | 4.5-5.5% | UNR proximity, character homes, renovation potential | Value-add SFH, academic demand, BRRRR |
| Downtown Reno | $280K-$500K | 5.0-7.0% | Urban revitalization, entertainment district, early-stage gentrification | Urban early entry, value-add, 7+ year hold |
| Fernley | $300K-$450K | 5.5-7.0% | Reno spillover, affordability, new construction, Tesla corridor proximity | Cash flow focus, affordable entry, growth corridor |
Expert Insight: “Midtown Reno is the most underappreciated investment neighborhood in Nevada right now. The transformation over the last six years has been extraordinary. Properties that traded at $250,000 in 2016 are now $450,000 to $550,000, and the trajectory is not finished. The demographic coming into Midtown is a 28 to 38 year old tech professional earning $90,000 to $140,000 who wants walkability, restaurants, and an urban lifestyle. That demographic pays rent and stays. Midtown vacancy rates for well-managed properties have been consistently below 3 percent for the past four years.” – Jennifer Walsh, Reno Urban Investment Group
3. Property Types
| Investment Goal | Best Property Type | Best Neighborhoods | Minimum Capital |
|---|---|---|---|
| Maximum Appreciation | Master-planned SFH | South Reno, Damonte Ranch | $140,000+ |
| Best Rent Growth | Urban condo or renovated home | Midtown, Old Southwest | $100,000+ |
| Best Cash Flow in Metro | SFH workforce housing | Sparks, North Reno, Fernley | $100,000+ |
| Most Stable Demand | Near-campus housing | University District, Northwest Reno | $120,000+ |
Our Complete Renovation & Remodeling Cost Guide covers 400+ pages of project-by-project breakdowns with real contractor pricing ranges.
4. Cost Analysis
Acquisition Cost Breakdown (Reno)
| Expense Item | Typical Cost | Example ($450,000 Property) | Notes |
|---|---|---|---|
| Down Payment | 25% (investment) | $112,500 | Standard investment property requirement |
| Closing Costs | 2-3% of price | $9,000-$13,500 | Nevada transfer tax is modest; Washoe County recording fees standard |
| General Inspection | $400-$650 | $500 | Reno has cold winters; inspect heating systems, roof insulation, and pipe insulation |
| Radon Test | $150-$300 | $200 | Reno has elevated radon levels in many areas; test before purchase; mitigation systems $800-$2,500 |
| HOA Document Review | $250-$500 | $350 | Required in master-planned communities; verify rental policy and pending assessments |
| Initial Repairs | 0-8% of price | $0-$36,000 | Older Reno homes may need heating system updates and weatherization |
| Reserves (6 months) | 6 months expenses | $12,000-$16,000 | Include winter weather reserves; snow removal can be an unexpected cost |
| TOTAL MINIMUM ENTRY | ~28-32% of value | $134,550-$178,550 | More accessible than Bay Area equivalent; significantly below Seattle market entry |
Sample Cash Flow Analysis: Sparks Single-Family Home (Tesla Workforce Housing)
| Item | Monthly | Annual | Notes |
|---|---|---|---|
| Gross Rent | $2,050 | $24,600 | 3BR, Sparks, market rate, Tesla workforce area |
| Less Vacancy (5%) | -$103 | -$1,230 | Reno metro vacancy low; Tesla employment creates consistent demand |
| Property Taxes | -$263 | -$3,150 | ~0.70% of $450K assessed; Washoe County rate lower than Clark County |
| Insurance | -$115 | -$1,380 | Slightly higher than Las Vegas; include snow/winter coverage |
| HOA Fees | -$80 | -$960 | Sparks master-planned HOA; modest |
| Property Management (9%) | -$185 | -$2,214 | Competitive Reno PM market |
| Maintenance + CapEx (8%) | -$164 | -$1,968 | Include heating system and roof; four seasons increases maintenance vs. desert markets |
| Net Operating Income | $1,140 | $13,698 | Before mortgage |
| Mortgage ($460K purchase, 25% down, 6.75%, 30yr) | -$1,119 | -$13,428 | Principal and interest on $345,000 loan |
| CASH FLOW | +$21 | +$270 | Near-breakeven positive in a tech-economy market; strong total return story |
| Cap Rate | 2.98% (NOI / Purchase Price) | Strong for a tech-economy market | |
| Total Return (9% appreciation) | ~40% | Including appreciation, equity, principal paydown on 25% down |
This example shows the Reno investment profile: near-breakeven cash flow in a tech-employment market with strong total return driven by appreciation. Compare to Seattle, where the same quality of property produces $1,500 to $2,500 per month in negative carry. Reno’s combination of tech-driven appreciation and near-positive cash flow makes it one of the most compelling mid-size city investment markets in the Western United States. As rents grow 4 to 6 percent annually with the Tesla and tech economy, the cash flow position improves meaningfully year over year.
Reno-Specific Operating Cost Considerations
| Cost Item | Typical Range | Reno Consideration |
|---|---|---|
| Heating System | $300-$600/year maintenance | Reno winters average 20 to 30 days below freezing. Forced air furnaces, heat pumps, and boilers all require annual servicing. Budget $6,000 to $12,000 for furnace replacement every 15 to 20 years. |
| Roof Snow Load | $200-$500/year | Unlike Las Vegas, Reno receives 20 to 30 inches of snow annually. Roofs must be rated for snow load. Inspect gutters, flashing, and drainage annually. Ice dams can cause significant water damage if unaddressed. |
| Landscaping | $100-$200/month | Reno properties have landscaping needs different from Las Vegas: spring cleanup, lawn care through summer, fall leaf removal, and winter snow removal. Four-season properties have higher annual landscaping costs. |
| Radon Mitigation | $800-$2,500 one-time | Reno has elevated radon levels due to underlying geology. Test before purchase. If mitigation is needed, factor cost into offer. Active mitigation systems require minimal ongoing maintenance after installation. |
| Property Tax | 0.5-0.8% of value | Washoe County effective rates average 0.6 to 0.75 percent, slightly below Clark County. A $450,000 Reno home generates approximately $2,700 to $3,375 in annual property taxes. |
| Insurance | $1,200-$2,400/year | Slightly higher than Las Vegas due to four-season weather and some wildfire risk in areas bordering the Sierra Nevada foothills. Verify wildfire risk zone for specific addresses near the foothills. |
Expert Insight: “The single thing Reno investors from California consistently underestimate is the four-season operating cost difference. They run numbers based on what they know from Sacramento or San Jose, where you basically only have summer and mild winter. In Reno, you have a real winter. That means furnace servicing, roof maintenance, snow removal, and potential pipe freeze issues in older properties. I budget 9 to 10 percent of annual rent for maintenance and CapEx in Reno versus 7 to 8 percent in Las Vegas. The additional 2 percent is entirely about the four seasons. It is not a deal breaker; just build it into your model from day one.” – Carlos Mendez, Northern Nevada Investment Properties
5. Legal Framework
✅ Reno Operates Under Nevada’s Strongly Landlord-Favorable Law
Reno and Washoe County operate under Nevada Revised Statutes Chapter 118A, the same investor-friendly framework covering all of Nevada. No rent control, no just cause eviction requirement at lease end, and a 3 to 5 week eviction process for non-payment are the headline advantages. Reno does not add significant additional regulatory burden compared to other Nevada cities. The City of Reno requires a business license for rental properties and Washoe County has standard building code requirements, but the overall framework remains highly favorable for property investors relative to virtually any California or Pacific Northwest market.
Nevada State Law: Key Provisions
- No Rent Control: Nevada prohibits local rent control ordinances statewide. Reno landlords may raise rents to full market rate with 45 days written notice, with no limit on frequency or amount of increase.
- No Just Cause Eviction: At lease end, Reno landlords can choose not to renew for any legal reason. No justification required to the tenant or any government entity.
- 5-Day Pay or Quit: Non-payment evictions begin with a 5-day notice. Uncontested cases typically complete in 3 to 5 weeks, significantly faster than California’s 3 to 6 month process.
- Security Deposits: Maximum 3 months rent. Must return with itemized deductions within 30 days of move-out.
- Habitability: Functional heating is a legal requirement for Reno rental properties, which is critical given winter temperatures that regularly drop below freezing. Unlike Las Vegas where HVAC cooling is the habitability obligation, Reno heating failure can trigger lease breach claims in winter months.
- Lease Non-Renewal: Annual leases expire at term end without cause required. Month-to-month tenancies require 30 days notice from either party.
Reno and Washoe County Specific Requirements
- City of Reno Business License: All rental properties within Reno city limits require a City Business License, renewed annually. Properties in Sparks require a City of Sparks license; unincorporated Washoe County properties have their own permit requirement.
- Washoe County Building Code: Rental property modifications, additions, and significant repairs require permits. Unpermitted work discovered at sale can complicate transactions and create liability.
- Short-Term Rental Rules: Reno and Washoe County have STR ordinances requiring permits. STR regulations have been evolving; verify current requirements for the specific property address and jurisdiction before purchasing for STR purposes.
- HOA Rules in Master-Planned Communities: South Reno, Damonte Ranch, Spanish Springs, and similar communities have HOA rules governing rental activity, exterior maintenance, tenant approval, and modifications. Review CC&Rs before purchase.
- Radon Disclosure: Nevada requires radon testing disclosure. Elevated radon is common in Reno; mitigation is standard practice and should be completed before tenant occupancy.
Reno Key Resources
- City of Reno Business License: reno.gov
- Washoe County Assessor: washoecounty.gov/assessor
- Nevada NRS Chapter 118A: leg.state.nv.us
- Reno-Sparks Association of Realtors: rsar.com
| Issue | Reno / Nevada Rule | Investor Impact |
|---|---|---|
| Rent Control | Prohibited statewide; unlimited increases with 45 days notice | Raise to market rate at every renewal; Reno’s 4-6% annual rent growth fully capturable |
| Eviction Speed | 3 to 5 weeks for non-payment | Fast resolution; dramatically better than California; limits financial exposure |
| Heating Habitability | Functional heating legally required; unique to Reno vs. Las Vegas | Service heating systems before each winter; a December heating failure creates immediate habitability obligations |
| Business License | Required from City of Reno or applicable jurisdiction | Modest annual cost; must be obtained for each jurisdiction (Reno, Sparks, or Washoe County) |
| State Income Tax on Rental Income | None | Full rental income retained; Bay Area investors save 9.3% to 13.3% per year on Nevada rental earnings |
| Radon | Disclosure required; mitigation standard practice | Test before purchase; budget $800 to $2,500 for mitigation if needed; complete before tenant occupancy |
6. Step-by-Step Reno Investment Playbook
Choose Your Reno Strategy
Reno supports distinct investment strategies depending on your priority between appreciation, cash flow, and tenant quality:
Tech Executive Appreciation Play
Buy in South Reno master-planned communities. Accept 4 to 5 percent cap rates in exchange for tech executive tenants, top schools, Lake Tahoe proximity, and consistent 9 to 12 percent appreciation. The lowest management intensity strategy available in Reno.
Urban Value-Add Play
Buy in Midtown or Old Southwest. Renovate to capture the young professional premium. Strongest rent growth in the metro with value-add returns that can significantly exceed purchase price within 3 to 5 years. Requires contractor relationships and active management.
Tesla Workforce Housing
Buy in Sparks, Spanish Springs, or North Reno. Target Tesla and tech sector employees as tenants. Better cash flow than South Reno with strong appreciation from metro growth. More accessible entry capital than premium Reno submarkets.
University District Academic Housing
Buy within 1 mile of UNR campus. Optimize for per-bedroom rental income from students, graduate students, and faculty. Academic calendar creates predictable lease cycles. Medical school expansion driving premium demand for quality near-campus housing.
Build Your Reno Team
- Reno-Specialist Agent: Must understand the full submarket landscape from South Reno’s master-planned communities to Midtown’s value-add scene. Should be able to tell you immediately which South Reno HOA communities permit rentals and know current Tesla workforce housing demand dynamics in Sparks.
- Nevada LLC Attorney: Form before your first purchase. Washoe County and Clark County LLCs have the same strong Nevada charging order protections. Essential for any out-of-state investor building a Reno portfolio.
- Reno Property Manager: Critical distinction: ask whether they manage in Sparks, North Reno, and Midtown, not just South Reno. A manager who only knows the premium master-planned communities will not serve a diverse portfolio well. Also ask specifically about their winter maintenance protocols for heating systems.
- Northern Nevada CPA: Reno-specific tax considerations include Washoe County property tax appeals, the interaction between rental income and Nevada trust structures for California-based investors, and depreciation optimization for four-season properties with higher CapEx.
- Licensed HVAC and Heating Contractor: Pre-establish the relationship. A December heating failure in Reno is a habitability emergency. Having a contractor on call before winter is not optional.
Expert Tip: Reno’s property management market is competitive but varies significantly in quality. When interviewing property managers, ask: “What is your process when a tenant reports a heating failure in January?” The answer reveals whether they have genuine Reno operational experience. Managers who reference a 24-hour response for habitability emergencies and have preferred HVAC contractor relationships are the standard you need. Managers who give vague answers about normal business hours are not equipped for Reno winter management.
Reno-Specific Due Diligence
Physical Due Diligence
- Radon test on all properties, especially those with basements or crawl spaces; Reno has elevated radon in many areas
- Heating system age and condition; furnace replacement budget if over 15 years old
- Roof condition for snow load capacity; inspect flashing, gutters, and drainage for winter performance
- Pipe insulation especially in crawl spaces and exterior walls; freeze damage is expensive in older Reno homes
- Foundation drainage; Reno receives winter precipitation; verify drainage slopes away from foundation
- Wildfire risk assessment for properties near Sierra foothills; verify insurance availability and cost before purchase
- Windows and door seals; energy efficiency matters more in Reno’s four-season climate than in Las Vegas
Regulatory and HOA Due Diligence
- Confirm jurisdiction (City of Reno, City of Sparks, or Washoe County unincorporated) as business license requirements differ
- Obtain and review CC&Rs for master-planned communities; confirm rental policy in writing from HOA management
- Verify STR eligibility if short-term rental is planned; confirm both city permit eligibility and HOA policy
- Check for any open building permits or code violations on older Reno properties
- Confirm school attendance boundaries for family rental strategy; Reno school quality varies significantly by zone
- Review HOA meeting minutes for pending special assessments in master-planned communities
Managing Effectively in Reno
- Winter preparation is mandatory: Service heating systems every October before cold weather arrives. Winterize any exterior pipes. Ensure gutters are clear before first snowfall. Establish a snow removal arrangement for properties in areas without HOA snow service. Winter-related maintenance failures are Reno’s most common and costly landlord liability.
- Capture Reno’s rent growth: Reno rents have grown 4 to 6 percent annually for the past several years. Nevada’s no-rent-control law means you can and should raise to market rate at every lease renewal. Investors who raise rents annually compound their income significantly. Investors who leave rents flat for 3 to 4 years lose that compounding permanently.
- Tech tenant marketing: For South Reno and Midtown properties, market specifically to Tesla, Switch, and university affiliates. List on LinkedIn, post in Reno tech community groups, and mention Tesla commute time in listing descriptions. Properties marketed to tech tenants consistently achieve 5 to 10 percent premium rents over generic listings.
- University lease cycle: For properties near UNR, offer August to August leases aligned with the academic calendar. Market in February and March for August availability. Offering furnished or semi-furnished options for graduate students can command 15 to 25 percent rent premiums.
- Wildfire insurance verification: For properties near the Sierra foothills, verify insurance availability annually. The California wildfire insurance crisis has spilled into Nevada for some foothills properties. Confirm your coverage is not subject to non-renewal before each policy term.
7. Financing Options for Reno
| Loan Type | Down Payment | Rate Premium | Best For | Reno Note |
|---|---|---|---|---|
| Conventional Investment | 25% | +0.5-0.75% | W-2 income investors; most common choice | Most Reno properties below conforming limit; no jumbo required for most purchases |
| Jumbo Investment | 25-30% | +0.75-1.25% | South Reno properties above $806,500 conforming limit | Required for upper South Reno and premium mountain community properties |
| DSCR Loan | 25-30% | +1-2% | LLC borrowing; no income documentation | Works for Sparks, North Reno, and some Midtown properties where rents support 1.0x DSCR; does not work for premium South Reno at current cap rates |
| Portfolio Loan | 20-25% | +0.75-1.5% | Multi-property investors; self-employed | Nevada State Bank, Banner Bank, and local Reno lenders offer portfolio products for multi-property investors |
| House Hacking (FHA) | 3.5% | Standard + MIP | Owner-occupying one unit; first investment | Good entry strategy near UNR with duplexes in the University District; buy a duplex, live in one unit, rent the other |
| Hard Money (Bridge) | 15-25% | 8-12% rate | Value-add acquisitions; Midtown BRRRR | Several Northern Nevada hard money lenders active; useful for Midtown and Old Southwest value-add acquisitions |
| New Construction Builder Financing | 5-20% | Below market with buydown | New construction in South Meadows, Spanish Springs | Builders in South Meadows and Fernley periodically offer rate buydown incentives improving first-year cash flow |
Reno Financing Reality: Unlike Las Vegas where DSCR loans work broadly across most submarkets, Reno’s higher price-to-rent ratios in premium areas mean DSCR qualification is submarket-dependent. Sparks and North Reno properties generally qualify at 1.0x; South Reno properties at current cap rates and interest rates typically fall below 1.0x DSCR and require full income documentation. This means serious Reno investors building larger portfolios often use a combination of conventional loans for premium properties and DSCR loans for Sparks and workforce properties within their LLC structure. Work with a Nevada-experienced mortgage broker who understands this nuance.
8. Frequently Asked Questions

Knowledge Quiz: Reno Real Estate Investment
Open Quiz
5 quick questions on what you just learned about Reno investing
1) What does the guide identify as the primary reason Bay Area tech workers are relocating to Reno in large numbers?
Answer: C
The guide specifically notes that a software engineer earning $180,000 in California saves $15,000 to $22,000 annually in Nevada state income tax alone, plus $3,000 to $5,000 per month in housing cost savings. Combined with the 3.5-hour drive to San Francisco allowing occasional Bay Area visits, the financial case is overwhelming. This creates self-reinforcing migration that has driven Reno’s rental demand growth since 2015.
2) What important due diligence item does the guide say is unique to Reno and not required in Las Vegas?
Answer: A
The guide specifically calls out radon testing as mandatory for Reno properties and notes it is not required in Las Vegas due to different geology. Heating system inspection is also critical in Reno given winters that regularly drop below freezing, while Las Vegas investors only need HVAC cooling inspections. These are two Reno-specific due diligence items that investors coming from Las Vegas or California often miss.
3) Why does the guide say the expert recommends budgeting 9 to 10 percent of annual rent for maintenance in Reno versus 7 to 8 percent in Las Vegas?
Answer: D
The expert quote in the guide specifically explains that the additional 2 percent maintenance budget in Reno vs. Las Vegas is entirely attributable to four-season climate costs: furnace servicing, roof maintenance for snow, fall leaf removal, snow removal, and potential pipe freeze issues in older properties. These costs simply do not exist in Las Vegas’s desert climate where the primary concern is desert-specific HVAC wear.
4) What habitability obligation is unique to Reno that landlords must understand but does not apply in Las Vegas?
Answer: B
The guide’s legal framework section specifically notes that while Las Vegas habitability focuses on HVAC cooling, Reno’s habitability requirement for rental properties centers on functional heating given winters that regularly drop below freezing. The guide recommends servicing heating systems every October before cold weather arrives. A December furnace failure creates an immediate habitability obligation that must be resolved urgently, not during normal business hours.
5) Which Reno neighborhood does the guide’s expert quote identify as the most underappreciated investment neighborhood in Nevada, with vacancy rates consistently below 3 percent for four consecutive years?
Answer: C
The expert quote from Jennifer Walsh of Reno Urban Investment Group specifically calls Midtown Reno the most underappreciated investment neighborhood in Nevada. The quote notes properties appreciated from $250,000 in 2016 to $450,000 to $550,000 today, with vacancy below 3 percent for four consecutive years. The tenant profile of 28 to 38 year old tech professionals earning $90,000 to $140,000 seeking walkability creates durable rental demand supporting the investment thesis.
Work With a Local Expert in Reno
We are building a verified network of real estate professionals across every market we cover.

About Our Expert Network
We are finalizing partnerships with verified real estate professionals across every market featured on Builds and Buys. Each expert is selected for hands-on investment experience, local market knowledge, and commitment to helping investors make sound decisions.
- Proven experience across Reno’s diverse submarkets from South Reno to Midtown to Sparks
- Deep knowledge of Reno’s tech economy and California migration dynamics
- Guidance on financing, entity structure, and submarket selection
- Access to off-market and pre-market Reno opportunities
- Full transaction support from search through closing
Services Covered
- Property sourcing and acquisition
- Investment analysis and underwriting
- Buyer representation
- Tesla workforce housing strategy
- Value-add and renovation guidance
- University district academic housing
- Legal and title referrals
- Financing and lender connections
- Property management referrals
- Insurance and inspection referrals
- 1031 exchange coordination
- Exit strategy planning
Get Connected or Join Our Network
Looking for a Reno expert? We will connect you with the right professional for your submarket and strategy.
Contact us at support@buildsandbuys.com
Find Specialized Reno Real Estate Professionals
Ready to Invest in Reno?
Reno is Nevada’s technology transformation story and one of the most compelling mid-size city investment markets in the American West. The combination of Tesla and tech sector employment, sustained California migration driven by Nevada’s zero income tax, University of Nevada demand, geographic supply constraints, and landlord-favorable Nevada law creates a structural investment case that is difficult to match in any comparable market. Investors who understand the submarket differences between South Reno’s appreciation play and Sparks’ cash flow thesis, who plan for four-season operating costs, and who build the right local team are consistently generating outstanding total returns.
Continue Your Research
Nevada State Guide
See how Reno compares to Las Vegas, Henderson, Carson City, and other Nevada markets.
Sparks Guide
Deep dive into Sparks as a Tesla workforce housing market and cash flow investment opportunity.
144-Lesson Course
University-level real estate education covering financing, law, strategy, and management.
For further guidance, explore our State-by-State Investor guides, browse our expert articles, or follow our Step-by-Step Investment Guide.