Leander Real Estate Investment Guide For 2026
A comprehensive resource for investors looking to capitalize on the Austin metro’s only genuine commuter rail suburb and one of America’s fastest-growing cities in 2026
Quick answers: Top 5 most searched Leander investment questions ▼
Migration data: Where renters and buyers are coming from in Leander ▼
In This Guide
Click on any section to navigate directly to that content
1. Leander Market Overview
Market Fundamentals
Leander occupies a genuinely unique position in this Texas series: it is the only city whose investment case includes real, operating commuter rail. Capital Metro’s Red Line terminates at Leander Station, offering an actual 30-45 minute car-free commute to downtown Austin along an 8-stop, 32-mile route. Combined with a top 10% Texas school district, meaningful tech-corridor employment access, and one of the fastest population growth rates in the country, Leander’s fundamentals are genuinely strong even though its headline price statistics can look noisy month to month.
Key economic indicators that define Leander’s investment case:
- Population: approximately 75,000, up from roughly 48,000 in 2020, named the fastest-growing large city in the U.S. by the 2019 Census Bureau
- MetroRail Red Line: Leander Station serves as the line’s northern terminus, connecting to 8 stops and downtown Austin
- Median Household Income: approximately $102,000
- Major Nearby Employers: Apple’s 3 million square foot north Austin campus, Samsung’s Taylor fab plant, Dell, Tesla, and Oracle
- School District: Leander Independent School District, ranking in the top 10% of Texas districts per TEA ratings
- Master-Planned Community Breadth: Community-level medians range from approximately $378,000 (Summerlyn) to $856,500 (Travisso)
Leander’s median price data is genuinely volatile across sources, reflecting the mix-shift effect of so many large, price-differentiated master-planned communities closing in different proportions each month. Investors should anchor to community-specific comparables rather than any single citywide statistic, and should note that Leander experienced the Austin metro’s sharpest suburban correction in 2023, a real data point that its subsequent full recovery helps contextualize.
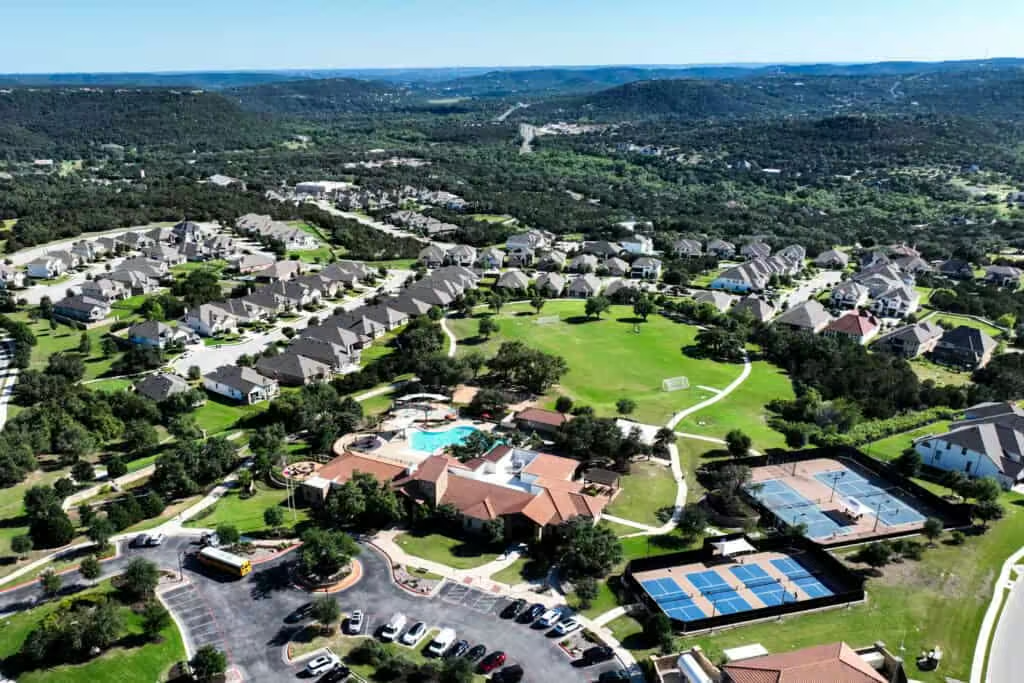
Leander’s MetroRail Red Line station offers a genuine car-free commute option unique among Austin-area suburbs in this series
2026 Economic Outlook
- Project Connect’s $7.1 billion transit expansion continuing to add regional rail and light rail connectivity
- Continued active building in Travisso, Bryson, and other master-planned communities
- Builder rate buydowns of 1-2 points remaining a meaningful moderating force on effective monthly payments
- Downtown Leander’s Northline District continuing to develop genuine downtown character
- Forecasts projecting 3-5% annual appreciation through 2027 given continued job growth and limited resale inventory
Investment Climate
Leander rewards investors who understand its community-specific price structure and its genuine transit differentiator. Successful Leander investors tend to share a few characteristics:
- Community-specific underwriting given the massive spread from Summerlyn’s $378,000 median to Travisso’s $856,500 median within a single city
- Rail-proximity awareness when evaluating long-term appreciation potential, given the genuine, infrastructure-backed transit thesis
- MUD/PID tax verification given that even sections within the same community, like Crystal Falls, can carry different combined tax rates
- Commute-corridor testing given documented bottlenecks like the Ronald Reagan Boulevard chokepoint affecting some Crystal Falls sections
- Historical context understanding that the 2023 correction was real but has since fully reversed, supporting confidence in the market’s underlying resilience
Texas’s landlord-friendly statewide framework and no state income tax apply fully in Leander. The core investment thesis is straightforward: Leander offers a genuinely differentiated, rail-connected Austin suburb with top-tier schools and strong income demographics, and its 2023 correction and subsequent recovery demonstrate real market resilience rather than fragility.
Historical Performance
| Period | Market Driver | Avg Annual Change | Key Event |
|---|---|---|---|
| 2019 | Population growth recognition | N/A | U.S. Census Bureau names Leander the fastest-growing large city in the nation |
| 2020-2022 | Pandemic-era Austin-overflow migration | 15-20% | 2020 Project Connect $7.1B transit expansion approved by Austin voters |
| 2023 | Rate shock, overbuilding correction | -7.1% | Austin metro’s sharpest suburban price decline |
| 2024-2025 | Full recovery, market stabilization | 2-4% | Prices recover to approximately 42.6% above 2020 levels |
| 2026 | Continued stabilization, modest growth resuming | 2.5-5% (source-dependent) | Median stabilized in the $435,000-$470,000 range for two consecutive years |
Leander’s honest recent history includes a real, documented correction, the sharpest suburban decline in the Austin metro during 2023, followed by a genuine full recovery. This pattern is meaningfully different from Kyle’s ongoing supply absorption or San Marcos’s structural demand shift elsewhere in this series: Leander’s dip came and went, and prices have since stabilized and resumed modest growth. This track record of resilience is itself a data point worth weighing when evaluating the market’s risk profile.
Demographic Trends Driving Demand
- MetroRail Commuters – A genuine, infrastructure-backed renter and buyer pool seeking car-free access to downtown Austin
- Tech Sector Employment – Apple, Samsung, Dell, Tesla, and Oracle all within a reasonable commute, drawing high-income households
- Leander ISD School Demand – A top 10% Texas school district drawing young families specifically for academic quality
- Multi-Generational Migration – Grandparents following adult children to live nearby in smaller homes, per the mayor’s own account
- Hill Country Lifestyle Buyers – Communities like Travisso and Crystal Falls drawing buyers specifically for elevated terrain and scenic views
- Out-of-State Relocation – Genuine buyer interest from Dallas, Los Angeles, and Houston metros, per Redfin migration data
📚 New to real estate investing? Master the fundamentals with our professional course Learn more →
2. Neighborhood Hotspots
Leander Investment Neighborhood Map
Interactive map of Leander’s investment neighborhoods. Green stars show top hotspots, blue circles mark established markets, and orange circles highlight emerging areas.
Core Investment Neighborhoods
Detailed Submarket Analysis: All Leander Neighborhoods
| Neighborhood | Price Range (SFH) | Cap Rate | Growth Drivers | Best Strategy |
|---|---|---|---|---|
| Downtown Leander | $350K-$500K | 4.5-5.5% | MetroRail access, downtown development | Rail-commuter buy-and-hold |
| Crystal Falls | $400K-$999K+ | 4.0-5.0% | Established maturity, wide housing variety | Established-community buy-and-hold |
| Bryson | $380K-$550K | 4.5-5.5% | On-site elementary, commuter convenience | Family buy-and-hold |
| Summerlyn | $320K-$430K | 5.0-6.0% | Most affordable Leander ISD access | Cash flow buy-and-hold |
| Mason Hills | $400K-$600K | 4.0-5.0% | Fastest appreciation citywide, limited lots | Appreciation-focused hold |
| Block House Creek | $350K-$480K | 4.5-5.5% | No MUD bond, lower tax burden | Balanced buy-and-hold |
| Mason Creek | $340K-$460K | 4.5-5.5% | Established infrastructure, moderate pricing | Balanced buy-and-hold |
| Rancho Sienna | $470K-$700K | 3.5-4.5% | Strong amenities, community connection | Premium long-term hold |
| Travisso | $450K-$2.6M+ | 2.5-3.5% | Hill Country views, resort amenities | Luxury appreciation hold |
Expert Insight: “Crystal Falls’ non-obvious edge is that its maturity is genuinely the asset. Newer communities like Travisso have bigger houses and flashier amenities, but Crystal Falls has twenty-year-old live oaks, an operating golf club, and a settled daily routine that money can’t instantly buy elsewhere in Leander. Investors should also test their actual commute time at 7:30 AM, not 10 AM, before assuming a section’s proximity to the Ronald Reagan corridor works for them.” – LRG Realty, Crystal Falls neighborhood guide
3. Property Types
| Investment Goal | Best Property Type | Best Neighborhoods | Minimum Capital |
|---|---|---|---|
| Maximum Cash Flow | Value-tier school district SFH | Summerlyn | $80,000+ |
| Genuine Transit Thesis | Rail-commuter SFH | Downtown Leander, Bryson | $87,500+ |
| Proven Track Record | Established master-planned community | Crystal Falls | $100,000+ |
| Maximum Appreciation | Hill Country limited-lot community | Mason Hills | $100,000+ |
Don’t guess the costs. Our Complete Renovation & Remodeling Cost Guide covers 400+ pages of project-by-project breakdowns with real contractor pricing ranges.
4. Cost Analysis
Acquisition Cost Breakdown (Leander)
| Expense Item | Typical Cost | Example ($445,000 Property) | Notes |
|---|---|---|---|
| Down Payment | 25% (investment) | $111,250 | Standard for investment properties statewide |
| Closing Costs | 2-3% of price | $8,900-$13,350 | Title, escrow, lender fees, recording |
| MUD/PID Section Verification | $0 (verification, not a fee) | $0 | Essential; even different sections within Crystal Falls carry different combined tax rates |
| General Inspection | $400-$650 | $525 | More critical for Crystal Falls’ 10-20 year old inventory than newer communities |
| Initial Repairs | 0-8% of price | $0-$35,600 | Generally lower given the market’s high share of newer construction |
| Reserves (6 months) | 6 months expenses | $11,000-$14,500 | Elevated vacancy assumption given current elongated days-on-market environment |
| TOTAL MINIMUM ENTRY | ~29-40% of value | $131,575-$175,225 | Meaningfully higher absolute capital requirement than the cash-flow-oriented cities in this series |
Sample Cash Flow Analysis: Summerlyn Value-Tier School District Rental
| Item | Monthly | Annual | Notes |
|---|---|---|---|
| Gross Rent | $1,950 | $23,400 | 3BR home, Summerlyn, Leander ISD access |
| Less Vacancy (6%) | -$117 | -$1,404 | School-district family tenants typically show lower turnover |
| Property Taxes | -$730 | -$8,760 | ~2.3% effective rate on $380K assessed value, typical for Williamson County with MUD assessment |
| Insurance | -$145 | -$1,740 | Standard landlord policy; low flood exposure citywide (roughly 5% of properties at risk) |
| Property Management (9%) | -$176 | -$2,112 | Austin-metro managers commonly extend service coverage into the Leander corridor |
| Maintenance + CapEx | -$137 | -$1,644 | 7% of rent given newer construction with lower deferred maintenance |
| Net Operating Income | $645 | $7,740 | Before mortgage |
| Mortgage ($380K, 25% down, 6.75%, 30yr) | -$1,850 | -$22,200 | Principal and interest only |
| CASH FLOW | -$1,205 | -$14,460 | Negative with standard financing; a larger down payment materially improves this |
| Cap Rate | 2.0% | NOI / Purchase Price at this financed scenario; below the metro’s typical range for Summerlyn given a premium rent comp used here | |
| Total Return Estimate (3% appreciation) | ~8-10% | Including appreciation, principal paydown, and tax benefits |
This example is intentionally conservative and uses standard 25% down financing. Investors purchasing with a larger down payment, or targeting Summerlyn’s true lower-priced inventory closer to $340,000-$360,000, can push closer to positive leveraged cash flow while retaining Leander ISD access. As with the rest of this series, Leander rewards larger down payments and a longer hold horizon given its appreciation-weighted return profile.
Expert Insight: “Leander’s real edge over other Austin suburbs isn’t just the schools, it’s that the MetroRail station gives you a genuine second demand driver that doesn’t depend entirely on the broader housing cycle. Even during the 2023 correction, rail-adjacent listings in Downtown Leander and Bryson held up better than comparable properties further from the station. That’s not a coincidence.” – Ben Eddy, Colt Lending, Leander TX
5. Legal Framework
⚠️ Critical Leander Compliance Notice
Texas’s statewide landlord-friendly framework applies fully in Leander, and the city adds minimal local layering on tenant law. The real complexity here is HOA and MUD/PID-related, given the sheer scale and number of Leander’s master-planned communities and the tax rate variation even within a single community’s different sections. This guide provides an overview only. Always consult a Texas-licensed real estate attorney before acquiring rental properties, and verify HOA rules and tax district status independently for any specific parcel.
Texas and Leander-Specific Regulations
Leander operates under Texas’s statewide landlord-tenant framework (Texas Property Code Chapter 92) with a few locally significant considerations:
- No Rent Control: Texas prohibits municipal rent control outright.
- MUD/PID Tax Districts: Newer communities and even individual sections within established communities like Crystal Falls can carry different Municipal Utility District or Public Improvement District assessments, with documented rates like Travisso’s 2.4764% combined 2025 rate versus lower rates in MUD-free communities like Block House Creek.
- HOA-Governed Communities: The overwhelming majority of Leander’s housing stock sits within a master-planned community HOA; rental caps, minimum lease terms, and architectural requirements vary meaningfully by specific community and even section.
- Security Deposit Return: Must be returned within 30 days of move-out under Texas Property Code Section 92.103.
- School Zoning Precision: Not a legal requirement but a critical due diligence item, since Leander ISD zoning can vary by specific address.
- Williamson County Property Tax: Effective rates run approximately 2.2-2.5% of assessed value before any applicable MUD/PID assessment, moderate for the Austin metro.
Compliance Best Practices
Successfully operating Leander rental properties requires attention to HOA and tax-district detail:
- Section-Specific Tax Verification: Confirm the exact combined tax rate for the specific section of any large community, since MUD/PID status can vary within the same subdivision’s different phases.
- HOA Rental Restriction Review: Pull and review the specific community’s CC&Rs for rental caps, lease minimums, and any architectural review requirements before purchase.
- School Zone Verification: Confirm current Leander ISD campus assignment for the specific address directly with the district.
- Commute Corridor Testing: For rail-adjacent or commuter-focused properties, test actual travel times at genuine rush-hour departure times, not off-peak hours, given documented bottlenecks like the Ronald Reagan Boulevard corridor.
- Lease Compliance Review: Use current Texas Association of Realtors lease templates with appropriate HOA addenda where relevant.
- Local Property Management: Confirm specific experience with HOA-governed community compliance across Leander’s many master-planned communities.
Useful Leander Resources
- City of Leander Planning: leandertx.gov
- Williamson Central Appraisal District: wcad.org
- Leander ISD: leanderisd.org
- Capital Metro Trip Planner: capmetro.org
| Regulation | Leander Requirement | Texas Statewide | Investor Impact |
|---|---|---|---|
| Eviction | No local add-on; standard state process | 3-day notice to vacate, then eviction filing | Among the fastest eviction timelines nationally |
| MUD/PID Tax Rate | Varies significantly by community and even section | No statewide flat rate; varies by locality | Must verify per parcel before every offer |
| HOA Rental Rules | Vary by specific master-planned community | HOA authority governed by Texas Property Code Chapter 209 | Verify per property before purchase |
| Rent Increases | No local cap | No statewide cap or rent control | Full pricing flexibility |
| School Zoning | Varies significantly by specific address | Not a statewide regulatory matter | Verify per address; affects rent premium potential |
6. Step-by-Step Leander Investment Playbook
Define Your Leander Strategy
Leander rewards investors who pick a clear lane given its wide price ladder and unique transit differentiator. Choose from these proven strategies:
Rail-Commuter Appreciation Play
Buy in Downtown Leander or Bryson for genuine, infrastructure-backed appreciation potential tied to MetroRail and ongoing Project Connect transit expansion.
School-District Cash Flow Play
Buy in Summerlyn for the most affordable Leander ISD access in the city, targeting school-priority family tenants at the strongest available cap rate.
Established Community Buy-and-Hold
Buy in Crystal Falls for proven, two-decade track record, mature landscaping, and demonstrated resale strength against newer, still-developing competitors.
Luxury Long-Term Hold
Buy in Travisso or The Hills of Hidden Lake, accepting lower current yield in exchange for Leander’s strongest amenity packages and highest-tier appreciation potential.
Build Your Leander Team
Given Leander’s HOA-heavy, MUD/PID-variable development pattern, local expertise is essential. Non-negotiable team members:
- Leander-Specialist Real Estate Agent: Should track community-specific medians and know exact MUD/PID status by section, not just by community name.
- HOA-Familiar Attorney or Agent: Given the prevalence of master-planned HOAs, someone who can quickly pull and interpret a specific community’s CC&Rs is valuable.
- Commute-Testing Discipline: Personally test drive times at genuine rush hour for any property marketed on commute convenience.
- Texas Real Estate CPA: For entity structuring and depreciation strategy, and to help navigate Williamson County property tax appeal procedures.
- Local Property Manager: Confirm specific experience with HOA-governed community compliance across Leander’s many master-planned communities.
Expert Tip: Ask any prospective agent directly: “What is the combined tax rate for this specific section, and has it changed in the last three years?” An agent who can answer with the section-level historical trend, not just the community average, understands Leander’s real cost structure.
Leander-Specific Due Diligence
Standard due diligence items plus these Leander-critical checks:
Physical Due Diligence
- Foundation inspection given Central Texas Hill Country limestone and clay soil movement
- Roof and HVAC condition given regional heat exposure
- Age-appropriate inspection depth for Crystal Falls’ 10-20 year old inventory
- Verify flood zone status, though citywide risk is relatively low at roughly 5%
Regulatory and Market Due Diligence
- Confirm exact combined tax rate for the specific section via Williamson Central Appraisal District
- Pull and review the specific HOA’s CC&Rs for rental restrictions
- Verify exact Leander ISD campus assignment for the specific address
- Pull community-specific comparable sales rather than relying on the citywide median
Competing in Leander’s Market
Leander currently sits between balanced and seller’s territory depending on the specific data source and neighborhood. Strategies that work:
- Price within 2-3% of recent comps: Local agents note the days of closing 5%-plus above list are over, but well-priced homes still move quickly.
- Compare builder incentives on new construction: Rate buydowns of 1-2 points from builders like Pulte, Meritage, and Taylor Morrison can meaningfully change the effective monthly payment math.
- Target luxury-tier listings with longer days on market: Travisso’s longer DOM reflects a smaller buyer pool at that price point, not weakness, and can present negotiating opportunity for patient buyers.
- Move quickly on well-priced resale in desirable sections: Crystal Falls and Larkspur properties often go under contract in 10-15 days when correctly priced.
- Leverage down payment assistance programs where eligible: Programs like My Choice Texas Home are available to all homebuyers, not just first-time buyers, and can stack with standard loans.
Property Management in Leander
Leander’s family-oriented, HOA-governed, school-district-driven tenant base rewards attentive but relatively low-touch management. Key management focuses:
HOA and Community Compliance
Properties within Leander’s master-planned HOAs require a few specific management practices:
- Confirm and communicate any architectural review requirements to tenants regarding exterior changes
- Verify amenity access procedures, since some communities require a waiting period after closing before granting gate or facility access
- Budget for HOA dues, which can range from roughly $90 to $1,500-plus annually depending on the specific community and amenity package
- Maintain awareness of HOA fine and clean-up charge policies for rule violations
Typical Leander Management Fees
- Single-family management: 8-10% of monthly rent
- Luxury-tier management: Often 10-12% given higher-touch tenant expectations
- Leasing fee: 50-100% of one month’s rent
- Lease renewal fee: $150-$300 per renewal
7. Financing Options for Leander
| Loan Type | Down Payment | Rate Premium | Best For | Leander Note |
|---|---|---|---|---|
| Conventional Investment | 25% | +0.5-0.75% | Strong W-2 income, good credit | Most Leander properties fall well under conforming loan limits, though luxury-tier homes may require jumbo financing |
| New Construction Builder Financing | Varies | Often includes 1-2 point rate buydowns | Buyers in Travisso, Bryson, and other active-building communities | Design center credits of $10,000-$30,000 also commonly offered on select inventory |
| DSCR Loan | 25-30% | +1.5-2.5% | Investors who want no income verification | Leander’s appreciation-weighted cap rates mean DSCR coverage is often tighter than in cash-flow-oriented cities in this series |
| Jumbo Loan | 20-25% | +0.75-1.5% | Luxury-tier purchases in Travisso and comparable communities | Standard for most Travisso and Hills of Hidden Lake purchases above conforming limits |
| FHA / Down Payment Assistance | 3.5% | Standard + MIP | First-time buyers, house hackers | Programs like My Choice Texas Home are available to all buyers, not only first-timers |
Leander Financing Reality: Given Leander’s community-specific price spread, from Summerlyn’s $378,000 median to Travisso’s $856,500 median, the right financing product depends heavily on which price tier and strategy an investor is pursuing. Investors in the value tier should compare resale against active builder incentives carefully, while luxury-tier buyers should expect jumbo financing as the norm rather than the exception.
8. Frequently Asked Questions

Knowledge Quiz: Leander Real Estate Investment
Open Quiz
5 quick questions on what you just learned about Leander investing
1) What genuine differentiator does the guide say sets Leander apart from every other city in this Texas series?
Answer: B
Leander Station serves as the northern terminus of Capital Metro’s 32-mile Red Line, offering a genuine, operating 30-45 minute car-free commute to downtown Austin, a real transit-oriented development thesis unique among the Austin-area suburbs covered in this series.
2) What happened to Leander home prices in 2023, and what happened afterward?
Answer: C
Leander experienced a 7.1% price decline from 2022 to 2023, the Austin metro’s sharpest suburban correction, driven by overbuilding and the national rate shock. The market has since fully recovered, with prices reportedly sitting roughly 42.6% above 2020 levels.
3) Why does the guide caution against relying on any single citywide Leander price statistic?
Answer: A
Community-level medians range from roughly $378,000 (Summerlyn) to $856,500 (Travisso), so the citywide median can shift significantly month to month depending purely on which price segments happen to close, making community-specific comparables far more reliable than a single headline number.
4) Why can two homes in the same named Leander community, like Crystal Falls, carry different property tax rates?
Answer: D
Large master-planned communities are often developed in phases over many years, and different sections can fall under different Municipal Utility District or Public Improvement District bond obligations depending on when they were platted, meaning combined tax rates can genuinely vary even within one named community.
5) According to the guide, which Leander community is described as having posted the fastest recent appreciation, driven by its Hill Country setting and limited remaining lots?
Answer: B
Mason Hills is identified as the fastest-appreciating Leander community per Austin Board of Realtors data, cited at roughly 6.5% recently, driven by its scenic Hill Country positioning and an increasingly limited supply of remaining buildable lots.
Work With a Local Expert in Leander
We are building a verified network of real estate professionals across every market we cover.

About Our Expert Network
We are finalizing partnerships with verified real estate professionals across every market featured on Builds and Buys. Each expert in our network is selected for their hands-on investment experience, local market knowledge, and commitment to helping buyers and investors make sound decisions.
Our local specialists offer:
- Proven experience with investment and income-producing properties
- Deep knowledge of local pricing, rental yields, and neighborhood dynamics
- Guidance on financing, legal structure, and due diligence
- Access to off-market and pre-market opportunities
- Full transaction support from search through closing
- Ongoing portfolio and property management referrals
Services Covered
- Property sourcing and acquisition
- Investment analysis and underwriting
- Buyer representation
- Market comparables and valuations
- Short-term and long-term rental strategy
- Value-add and renovation guidance
- Legal and title referrals
- Financing and lender connections
- Property management referrals
- Insurance and inspection referrals
- 1031 exchange coordination
- Exit strategy planning
Get Connected or Join Our Network
Looking for a local expert to help with your investment? Reach out and we will connect you with the right professional for your market and strategy.
Are you a real estate professional with a track record working with investors? We are always expanding our network of verified local experts.
Contact us at support@buildsandbuys.com
Find Specialized Leander Real Estate Professionals
Ready to Invest in Leander?
Leander offers a genuinely rare combination among Austin-area suburbs: real, operating commuter rail infrastructure, a top-tier school district, and a demonstrated ability to fully recover from the sharpest suburban correction in the entire Austin metro. Investors who underwrite community-specific comparables rather than the noisy citywide median, verify section-level tax rates carefully, and consider proximity to the MetroRail station as a genuine long-term differentiator will find Leander one of the more resilient plays in this Texas series.
Continue Your Research
Texas State Guide
See how Leander compares to Austin, Cedar Park, Georgetown, and other Central Texas markets.
Step-by-Step Invest
Complete framework for building a real estate investment strategy from scratch.
144-Lesson Course
University-level real estate education covering financing, law, strategy, and management.
For further guidance, explore our State-by-State Investor guides, browse our expert articles, or follow our Step-by-Step Investment Guide.