Bellingham Washington Real Estate Investment Guide For 2026
A comprehensive resource for investors targeting one of the Pacific Northwest’s most desirable small cities, where a major university, Canadian border proximity, and an extraordinary outdoor lifestyle converge to create durable rental demand
Quick answers: Top 5 most searched Bellingham investment questions ▼
Migration data: Where people are moving from to Bellingham ▼
In This Guide
Click on any section to navigate directly to that content
1. Bellingham Market Overview
Market Fundamentals
Bellingham is Washington state’s northernmost major city and one of the most livable small cities in the United States. Situated between Seattle and Vancouver BC on Bellingham Bay, the city benefits from a remarkable concentration of demand drivers: a major university, a large regional healthcare system, strong lifestyle-driven in-migration, and the structural tax advantage of Washington state’s zero income tax. For real estate investors, this combination produces one of the most stable and multi-layered rental demand bases in the Pacific Northwest.
Key economic indicators that define Bellingham’s investment case:
- Population: 95,000+ city, 245,000+ Whatcom County
- Major Employers: Western Washington University (3,500+ staff), PeaceHealth St. Joseph Medical Center, Bellingham Technical College, BP Cherry Point Refinery (nearby Ferndale), Horizon Air maintenance facility, Haskell Corporation, City of Bellingham
- Western Washington University: 15,000+ students generating the city’s most reliable rental demand engine
- Median Household Income: $62,000 city, $72,000 Whatcom County (growing)
- Job Growth: 2.6% annually, above national average
- No State Income Tax: Ongoing draw for Seattle-area remote workers choosing Bellingham’s lifestyle
- Vacancy Rate: Under 3.5% citywide, under 2% in the WWU corridor during the academic year
Bellingham’s economy is anchored by the university and healthcare but diversifying through technology (several tech firms have opened satellite offices drawn by talent from WWU), outdoor recreation tourism, and growing cross-border commerce tied to the Canadian relationship. The city’s position as the last major urban center before the Canadian border gives it a unique regional economic role.
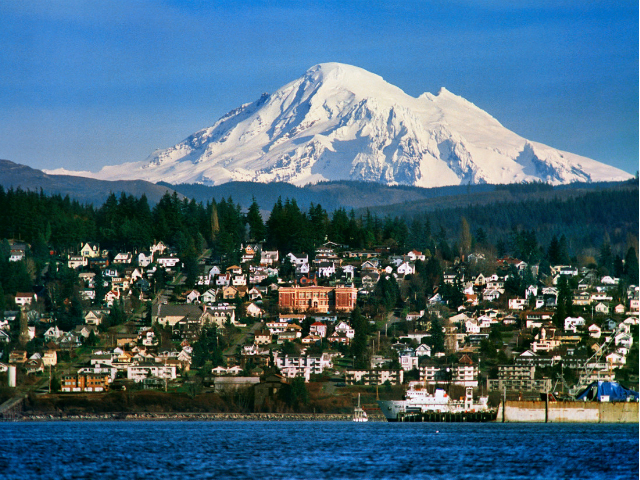
Bellingham’s waterfront and Bellingham Bay reflect a city defined by natural beauty, university culture, and constrained supply
2026 Economic Outlook
- WWU enrollment stable with growing graduate programs driving demand for quality rentals
- PeaceHealth expansion increasing healthcare employment in Barkley and north Bellingham
- Waterfront District redevelopment creating new urban density near downtown
- Remote work normalization accelerating Seattle-to-Bellingham migration
- Whatcom Smart Communities technology sector developing in Bellingham proper
- Port of Bellingham industrial revitalization supporting logistics employment
Investment Climate
Bellingham’s investment environment is defined by strong fundamentals, diverse demand drivers, and Washington state’s landlord-friendly regulatory framework. Unlike Seattle, Bellingham is not a single-thesis market. Investors can pursue student housing, professional family rentals, lifestyle-driven premium properties, value-add projects, or short-term rentals, all within the same city. Successful Bellingham investors tend to share a few characteristics:
- University cycle awareness managing the annual August tenant turnover in student-oriented properties
- Neighborhood thesis clarity understanding that Sehome student rentals, Fairhaven premium rentals, and Birchwood cash flow properties require very different management approaches
- Washington state regulatory literacy taking advantage of the state’s balanced landlord-tenant law compared to Oregon
- Lifestyle migration positioning understanding which property features attract the growing remote-worker tenant segment
- Supply constraint appreciation recognizing that Bellingham Bay, Chuckanut foothills, and urban growth boundaries create durable long-term appreciation pressure
Historical Performance
| Period | Market Driver | Avg Annual Appreciation | Key Event |
|---|---|---|---|
| 2010–2014 | Post-recession recovery, stable university demand | 3–5% | Bellingham weathers recession better than most markets due to WWU stability |
| 2015–2019 | Seattle spillover begins, lifestyle migration awareness grows | 7–10% | Seattle professionals discover Bellingham; Fairhaven demand surges |
| 2020–2022 | Pandemic remote work surge, inventory collapse | 16–24% | Remote workers flood market; multiple offers on everything; new construction cannot keep up |
| 2023–2024 | Rate normalization, modest correction | 1–4% | Inventory rose but student and lifestyle rental demand held firm |
| 2025–2026 | Rate stabilization, remote work normalization | 5–8% (projected) | Waterfront District activation, continued Seattle-to-Bellingham migration |
Bellingham’s 15-year track record shows average annual appreciation of 6 to 8%, with notably strong resilience during downturns due to the university anchor. A $280,000 Bellingham property purchased in 2010 would be worth approximately $600,000 to $680,000 today, while generating consistent rental income to a diverse tenant mix throughout.
Demographic Trends Driving Demand
- Western Washington University — 15,000+ students, limited on-campus housing, and growing graduate enrollment create the most reliable rental demand base in Whatcom County
- Seattle Remote Worker Migration — Professionals keeping Seattle-area salaries and choosing Bellingham for its natural beauty, community feel, and 35% lower home prices
- PeaceHealth Healthcare Employment — St. Joseph Medical Center employs thousands of healthcare workers who need quality housing near north Bellingham
- California Lifestyle Migrants — Bay Area and Southern California professionals seeking outdoor lifestyle access, lower costs, and Pacific Northwest culture
- Canadian Cross-Border Commerce — Whatcom County’s economic relationship with British Columbia supports border-area employment and indirect housing demand
- Outdoor Recreation Economy — Mt. Baker ski area, Chuckanut Drive, Bellingham Bay paddling, and North Cascades access attract a growing adventure tourism and remote worker segment
- Geographic Constraint — Bellingham Bay to the west, Chuckanut Mountain to the south, Lake Whatcom to the east, and urban growth boundaries create genuine supply limits that support long-term price appreciation
📚 New to real estate investing? Master the fundamentals with our professional course Learn more →
2. Neighborhood Hotspots
Bellingham Investment Neighborhood Map
Interactive map of Bellingham’s investment neighborhoods. Green stars show top hotspots, blue circles mark established markets, and orange circles highlight emerging areas.
Core Investment Neighborhoods
Detailed Submarket Analysis: All Bellingham Neighborhoods
| Neighborhood | Price Range (SFH) | Cap Rate | Growth Drivers | Best Strategy |
|---|---|---|---|---|
| Sehome / WWU Corridor | $480K–$680K | 5.5–7.5% | WWU enrollment, by-bedroom premium, perpetual demand | By-bedroom student rental, small multi-family |
| Fairhaven | $580K–$950K | 4.0–5.5% | Premium lifestyle demand, waterfront, limited supply | Appreciation hold, premium rental, STR opportunity |
| Lettered Streets / Alphabet District | $460K–$650K | 5.0–6.5% | Central location, walkability, value-add craftsman stock | Value-add SFH, BRRRR, professional rental |
| Birchwood | $380K–$490K | 6.0–7.5% | Affordability, working-class demand, cash flow | Cash flow portfolio, value-add, BRRRR |
| Barkley | $490K–$660K | 5.0–6.0% | PeaceHealth employment, newer stock, professional demand | Buy-and-hold, healthcare worker rental, low maintenance |
| Cordata | $490K–$640K | 4.5–5.5% | Family demand, good schools, Seattle transplants | Family rental, low-turnover suburban hold |
| Downtown / Waterfront District | $380K–$580K | 4.5–5.5% | Waterfront redevelopment, urban renewal, young renters | Urban appreciation play, condo, development potential |
| Samish Way Corridor | $400K–$530K | 5.5–7.0% | WWU adjacency, mixed-use zoning, affordable entry | Student/working-class rental, long-term hold |
| York | $380K–$500K | 6.0–7.5% | Gentrification path, central location, value-add | Value-add, emerging appreciation play |
| Ferndale (Whatcom County) | $330K–$440K | 6.5–8.5% | BP Cherry Point employment, affordability, growth | Best Whatcom County cash flow, portfolio building |
Expert Insight: “The most misunderstood opportunity in Bellingham is the Lettered Streets. Investors see the craftsman homes and assume they’re buying a cute house, not an investment. But a 1920s 4-bedroom on Alabama or Bay Street, renovated properly and rented by the room to grad students and young professionals, can achieve cap rates above 6.5%. The renovation cap is low here because the market absorbs quality upgrades immediately. We’re buying every one we can find under $550,000.” — Ryan Carlson, Principal, North Sound Property Investments
3. Property Types
| Investment Goal | Best Property Type | Best Neighborhoods | Minimum Capital |
|---|---|---|---|
| Maximum Rental Yield | By-bedroom SFH near WWU | Sehome, Columbia, Samish Way | $120,000+ |
| Best Appreciation | Fairhaven SFH or premium condo | Fairhaven, Lettered Streets | $150,000+ |
| Best Cash Flow | SFH or duplex in affordable north neighborhoods | Birchwood, York, Ferndale | $95,000+ |
| Lowest Management | New SFH or condo in healthcare corridor | Barkley, Cordata | $125,000+ |
Don’t guess the costs. Our Complete Renovation & Remodeling Cost Guide covers 400+ pages of project-by-project breakdowns with real contractor pricing ranges.
4. Cost Analysis
Acquisition Cost Breakdown (Bellingham WA)
| Expense Item | Typical Cost | Example ($545,000 Property) | Notes |
|---|---|---|---|
| Down Payment | 25% (investment) | $136,250 | Standard for investment properties. House hacking with FHA allows 3.5%. |
| Closing Costs | 2–3% of price | $10,900–$16,350 | Title, escrow, lender fees. Washington has no real estate excise tax at this price on primary purchase. |
| General Inspection | $400–$650 | $525 | Moisture inspection critical given Bellingham’s 60+ inches of annual rainfall |
| Sewer Scope | $175–$350 | $250 | Mandatory for pre-1985 Bellingham homes. Root intrusion common in older Lettered Streets stock. |
| Oil Tank Scan | $150–$300 | $200 | Pre-1965 homes only. Older Birchwood and Lettered Streets properties. |
| Initial Repairs / Updates | 0–10% of price | $0–$54,500 | Older Lettered Streets and Birchwood homes often need roof, HVAC, or deferred work |
| Reserves (6 months) | 6 months expenses | $9,000–$13,000 | Important buffer for the August student turnover month |
| TOTAL MINIMUM ENTRY | ~28–32% of value | $157,125–$221,075 | Comparable to Vancouver WA, significantly below Seattle |
Sample Cash Flow Analysis A: Sehome 4BR — By-Bedroom Student Rental
| Item | Monthly | Annual | Notes |
|---|---|---|---|
| Rental Income (4 rooms × $875) | $3,500 | $42,000 | Sehome 4BR, updated, 0.5 mile from WWU |
| Less Vacancy (8% — August turnover) | -$280 | -$3,360 | Annual August turnover month creates predictable vacancy |
| Property Taxes | -$510 | -$6,120 | ~1.1% effective rate on $556K assessed value |
| Insurance | -$130 | -$1,560 | Landlord policy, student rental designation |
| Property Management (10%) | -$350 | -$4,200 | Use student-housing specialist manager |
| Maintenance + CapEx | -$350 | -$4,200 | Student wear-and-tear; budget 10–12% of gross |
| Net Operating Income | $1,880 | $22,560 | Before mortgage |
| Mortgage ($545K, 25% down, 6.5%, 30yr) | -$2,587 | -$31,044 | P&I on $408,750 loan |
| CASH FLOW | -$707 | -$8,484 | Near breakeven; by-bedroom doubles vs. standard rental |
| Cap Rate | 4.14% | NOI / Purchase Price (by-bedroom model) | |
| Total Return (7.5% appreciation) | ~22% | On $136,250 invested, including appreciation and principal paydown |
Sample Cash Flow Analysis B: Birchwood 3BR — Standard Cash Flow Rental
| Item | Monthly | Annual | Notes |
|---|---|---|---|
| Rental Income (3BR SFH) | $2,000 | $24,000 | Birchwood, updated 3BR/1.5BA, 1,400 sq ft |
| Less Vacancy (5%) | -$100 | -$1,200 | Birchwood working-class demand is consistent year-round |
| Property Taxes | -$385 | -$4,620 | ~1.1% on $420K assessed value |
| Insurance | -$100 | -$1,200 | Standard landlord policy |
| Property Management (9%) | -$180 | -$2,160 | |
| Maintenance + CapEx | -$200 | -$2,400 | 10% of gross; older Birchwood stock budget accordingly |
| Net Operating Income | $1,035 | $12,420 | Before mortgage |
| Mortgage ($430K purchase, 25% down, 6.5%, 30yr) | -$2,040 | -$24,480 | P&I on $322,500 loan |
| CASH FLOW | -$1,005 | -$12,060 | Negative at current rates; significantly better at lower purchase price or larger down |
| Cap Rate | 2.89% | NOI / Purchase Price | |
| Total Return (7% appreciation) | ~19% | On $107,500 invested |
Note on cash flow improvement: Birchwood properties purchased below $380,000, properties with a second unit or ADU, or properties bought with a larger down payment often achieve positive cash flow. The by-bedroom model applied to a Birchwood property near Bellingham Technical College can add $600 to $900 per month in income, transforming the analysis entirely.
Expert Insight: “Investors who underwrite Bellingham the same way they underwrite a standard rental market miss the single most important variable: the by-bedroom premium near WWU. A $540,000 home rented as a standard 4BR gets $2,300/month. The same home rented room-by-room gets $3,400/month or more. That $1,100/month difference is the difference between a property that loses money every month and one that is close to breakeven or positive. The first question I ask any investor looking at Sehome is: have you modeled the by-bedroom scenario?” — Laura Hendricks, Investment Property Specialist, Whatcom County Real Estate Group
5. Legal Framework
✅ Bellingham WA: Washington State Law Applies — Landlord-Friendly by Pacific Northwest Standards
Bellingham follows Washington state’s Residential Landlord-Tenant Act (RCW 59.18). No local rent control. No just-cause eviction mandate. No first-in-time applicant selection rules. The city does have specific short-term rental rules and a business license requirement for all rental operations. Always consult a Washington-licensed real estate attorney before acquiring investment properties. Laws change and Bellingham’s city council has historically been progressive in orientation, meaning monitoring for new ordinances is wise.
Washington State Landlord-Tenant Law
- No Rent Control: Washington preempts local rent control. Bellingham cannot cap rent increases.
- Rent Increase Notice: 60 days written notice required for any rent increase.
- No-Cause Termination: Month-to-month tenancies can be terminated with 20 days notice (subject to legislative updates).
- Non-Payment Eviction: 14-day pay-or-vacate notice. Unlawful detainer follows if not cured.
- Security Deposits: Return within 21 days with itemized statement. No statewide cap.
- Habitability: Heat, hot water, weathertight structure, sanitation, and electrical maintained. 24-hour response for heat/hot water.
- Eviction Timeline in Whatcom County: Typically 4 to 8 weeks for non-payment; considerably faster than Multnomah County, Oregon.
Bellingham-Specific Rules
- Business License: All rental property operators must obtain a City of Bellingham business license. Annual fee scales with revenue.
- Short-Term Rentals: Bellingham requires a specific STR permit. The city has limited STR in some residential zones and requires the operator to be available to address complaints. Always verify current STR regulations with the City Planning Department before purchasing.
- Student Rental Properties: No special “student rental” licensing exists, but properties with 5 or more unrelated occupants may trigger additional zoning review. Most 4BR student rentals (4 unrelated roommates) are permissible in residential zones.
- No First-in-Time Rule: Unlike Seattle, Bellingham landlords may select among qualified applicants using their own judgment within federal and state fair housing law limits.
- No Source of Income Protection: Washington state does not mandate Section 8 voucher acceptance. (Verify current status as legislative changes are proposed periodically.)
Useful Bellingham Resources
- Washington RTA: app.leg.wa.gov (RCW 59.18)
- City of Bellingham Planning: cob.org/planning
- City Business License: cob.org/businesslicense
- Whatcom County Assessor: whatcomcounty.us/assessor
- Rental Housing Association of WA: RHAwa.com
| Regulation | Bellingham WA | Seattle WA | Portland OR |
|---|---|---|---|
| Rent Control | None (state ban) | None (state ban) | Yes (3% annual cap) |
| Just Cause Eviction | No | Yes (city ordinance) | Yes (state law) |
| Eviction Timeline | 4–8 weeks | 45–180+ days | 6–18 months |
| First-in-Time Rule | No | Yes (Seattle only) | No |
| Rent Increase Notice | 60 days | 180 days (above CPI) | 90 days |
| STR Rules | Permit required; zone restrictions | Primary residence only (effectively) | Primary residence only (120-day cap) |
⚠️ Student Rental Specific: Student-occupied properties often experience higher wear and tear, more frequent maintenance calls, and the concentrated August turnover that can create a month of vacancy. Insist on individual leases per occupant (rather than a single joint lease) to maintain Washington’s tenant-responsibility structure. Some property managers specialize in WWU student housing, and their expertise in managing the annual turnover cycle is worth the fee.
6. Step-by-Step Bellingham Investment Playbook
Define Your Bellingham Strategy
Bellingham offers four distinct investment theses, each targeting a different demand segment. Clarity on your thesis before buying is essential because the optimal neighborhood, property type, and management approach differ significantly across strategies.
University Housing Strategy
Buy near WWU in Sehome, Columbia, or Samish Way. Rent by the bedroom to students. Accept higher management intensity and August turnover in exchange for yields 30 to 50 percent above market-rate rentals.
Lifestyle Premium Strategy
Buy in Fairhaven or the Lettered Streets. Rent to remote workers, faculty, and lifestyle migrants at premium rates. Lower yield but stronger appreciation and lower management intensity with professional tenants.
Cash Flow / Value-Add Strategy
Buy affordable homes in Birchwood, York, or Ferndale. Focus on cash flow and BRRRR execution. Best for investors building a multi-property portfolio and prioritizing yield over appreciation.
Healthcare Corridor Strategy
Buy near PeaceHealth St. Joseph in Barkley. Target healthcare worker tenants who are stable, high-income, and prefer newer housing near work. Lower yield than student housing but dramatically lower management intensity.
Build Your Bellingham Team
- Whatcom County Investment-Focused Real Estate Agent: Must understand the by-bedroom rental model, WWU enrollment dynamics, and how to identify properties with the most flexibility for student or professional rental configurations.
- Washington State Real Estate Attorney: For entity setup (LLC preferred for liability protection, especially for student rentals), lease template review, and any legal disputes in Whatcom County Superior Court.
- Bellingham Property Management Company: Critically, choose a company with specific WWU student housing experience if pursuing that strategy. The August turnover cycle requires specialized systems that general property managers often lack.
- Whatcom County General Contractor: For value-add work. Local subcontractor relationships in Bellingham’s smaller market are important. Costs are lower than Seattle but must be verified with local bids.
- CPA familiar with both investment and student rental income: By-bedroom student rental has specific tax treatment and depreciation implications worth modeling before purchase.
Expert Tip: When selecting a student housing property manager, ask specifically: “What is your system for managing the August lease turnover? How do you handle move-out inspections, security deposit disposition, and re-leasing for the following September in a 30-day window?” The August cycle management is where most self-managing student rental investors fail.
Bellingham-Specific Due Diligence
Physical Due Diligence
- Moisture and mold inspection. Bellingham receives 60+ inches of rain annually. Moisture intrusion in older Lettered Streets and Birchwood homes is common and expensive.
- Sewer scope for all pre-1985 properties
- Oil tank scan for pre-1965 construction
- Roof condition and moss treatment (endemic in the Pacific Northwest)
- Foundation drainage given the city’s rainfall
- Radon testing for basement units
- HVAC age and condition, especially in older rental stock
Market Due Diligence
- Measure exact walking distance to WWU campus if targeting student rental (Google Maps walking route, not straight-line distance)
- Pull 6-month rental comps specific to property type and bedroom count
- Verify zoning allows intended use (multi-family, student occupancy count, STR)
- Check WWU enrollment trends and on-campus housing expansion plans
- Confirm flood zone status if near Whatcom Creek or Lake Whatcom
- Review any City of Bellingham STR permit history on the property
- Check Whatcom County assessor for recent valuation relative to purchase price
Competing and Winning in the Bellingham Market
- Move fast on Sehome properties: Well-priced properties near WWU receive multiple offers within 3 to 7 days. Pre-inspections (done before offering) allow competitive contingency-free offers that win without the highest price.
- Target the off-season: Bellingham’s market slows in December and January when student demand is low and fewer people are moving. Sellers who list in winter are often motivated; this is when value-add deals surface most readily.
- Know the by-bedroom math before you offer: The investor who has already modeled the by-bedroom scenario sees value that a conventional buyer misses. This asymmetric underwriting gives you confidence to pay closer to asking price on properties that pencil beautifully under the right strategy.
- Cultivate relationships with long-term Bellingham owners: Older homeowners in Birchwood and the Lettered Streets who have held for 30+ years are the best source of off-market deals. Direct mail and door-knocking in these neighborhoods produces results.
- Monitor WWU faculty housing: Faculty transitioning between institutions sometimes need a quick sale. These properties are typically well-maintained and located in the most desirable rental zones.
7. Financing Options for Bellingham
| Loan Type | Down Payment | Rate Premium | Best For | Bellingham Note |
|---|---|---|---|---|
| Conventional Investment | 25% | +0.5–0.75% | W-2 income, good credit, standard rental | Most Bellingham properties fall below the $806,500 conforming limit, keeping rates lower than jumbo market |
| FHA (House Hacking) | 3.5% | Standard + MIP | Owner-occupying one unit of 2–4 unit property | Excellent entry point; Sehome and Columbia duplexes ideal. Live in one unit, rent others to WWU students. |
| DSCR Loan | 25–30% | +1.5–2.5% | Self-employed investors, by-bedroom income | By-bedroom rental income is typically accepted for DSCR underwriting. May allow qualification where standard rental income would not. Verify with lender. |
| Portfolio Loan | 20–25% | +1–2% | Multiple properties, investors with 5+ loans | Bellingham’s local credit unions (WECU, Whatcom Educational Credit Union) offer portfolio products with local market knowledge |
| Hard Money (Bridge) | 15–25% | 8–12% rate | BRRRR acquisitions, value-add projects | Seattle-area hard money lenders are generally active in Whatcom County. Local Pacific Northwest lenders know the market well. |
| Conventional Owner-Occupied | 5–20% | Standard | Buying primary residence that can be converted to rental | A common strategy: buy as primary, live for 12–24 months, then convert to rental and buy next property. Builds portfolio with lower entry capital. |
Bellingham Financing Note: Whatcom Educational Credit Union (WECU) is one of Washington state’s strongest local lenders and has deep roots in the Bellingham community. Local credit unions often offer portfolio products, relationship-based underwriting, and local appraisal expertise that national lenders cannot match in smaller markets like Bellingham. For investors building a Whatcom County portfolio, establishing a relationship with WECU or similar local institutions early is a strategic advantage.
8. Frequently Asked Questions

Knowledge Quiz: Bellingham WA Real Estate Investment
Open Quiz
5 quick questions on what you just learned about investing in Bellingham WA
1) What is the “by-bedroom” rental model and why does the guide say it is critical to Bellingham investment analysis?
Answer: C
The by-bedroom model rents each room to a separate tenant, typically a WWU student, at $800 to $950 per room. A 4BR home rented this way generates $3,200 to $3,800 per month, compared to $2,100 to $2,400 as a standard rental. The guide identifies this $1,100+ monthly income difference as the most important variable in the Bellingham investment analysis.
2) Which Bellingham neighborhood does the guide identify as offering the best appreciation potential and STR income?
Answer: A
Fairhaven’s Victorian-era village character, waterfront access, and proximity to San Juan Islands ferry staging make it Bellingham’s premier appreciation and STR submarket. The guide notes Fairhaven STRs generate $4,000 to $6,500 per month during peak summer months, and the neighborhood’s constrained supply (bounded by Bellingham Bay, Chuckanut Mountain, and the historic district) supports long-term appreciation.
3) What is the guide’s assessment of direct Canadian buyer demand in Bellingham real estate?
Answer: D
The guide explains that while Canadians can legally purchase U.S. property, FIRPTA withholding (15% of gross sale price), limited access to U.S. financing, and cross-border tax complexity dampen direct purchase activity. The Canadian effect is more significant indirectly through cross-border commerce supporting Whatcom County’s economy. The guide explicitly warns against buying Bellingham real estate primarily on the basis of Canadian demand.
4) How does the guide recommend managing the WWU student rental August turnover cycle?
Answer: B
The guide outlines a specific protocol: begin re-leasing in January or February (strong Sehome properties are leased by March or April for the following September), use individual room leases per occupant, schedule move-out August 15 to 20, and complete cleaning and painting before September 1 move-in. Properly managed, the annual vacancy exposure is about 1 to 1.5 rooms worth of income, not 2 full months.
5) Which Bellingham neighborhood does the guide identify as best for investors focused on cash flow rather than appreciation or student housing?
Answer: C
Birchwood is identified as Bellingham’s best cash flow neighborhood, with cap rates of 6.0 to 7.5% and SFH prices of $380,000 to $490,000. The guide notes that Birchwood properties with lower purchase prices and stable working-class rental demand can approach positive cash flow even with conventional 25% down financing, which is exceptional for the Pacific Northwest I-5 corridor.
Work With a Local Expert in Bellingham WA
We are building a verified network of real estate professionals across every market we cover.

About Our Expert Network
We are finalizing partnerships with verified real estate professionals across every market featured on Builds and Buys. Each expert in our Bellingham network is selected for their specific knowledge of the WWU student rental market, Whatcom County investment dynamics, and understanding of the lifestyle-driven in-migration that defines the city’s demand story.
Our local specialists offer:
- Proven experience with WWU student housing and investment properties in Whatcom County
- Deep knowledge of Bellingham’s neighborhood investment dynamics and the by-bedroom rental model
- Guidance on short-term rental permitting, student lease structuring, and Washington state landlord law
- Access to off-market and pre-market opportunities in the Bellingham market
- Full transaction support from search through closing
- Ongoing property management referrals with student housing expertise
Services Covered
- Property sourcing and acquisition
- Investment analysis (including by-bedroom modeling)
- Buyer representation
- Market comparables and valuations
- Student rental and STR strategy
- Value-add and renovation guidance
- Legal and title referrals
- Financing and lender connections
- Student housing property management referrals
- Insurance and inspection referrals
- 1031 exchange coordination
- Exit strategy planning
Get Connected or Join Our Network
Looking for a Bellingham expert to help with your investment? Reach out and we will connect you with the right professional for your strategy.
Are you a Whatcom County real estate professional with investment transaction experience? We are expanding our verified local expert network.
Contact us at support@buildsandbuys.com
Find Specialized Bellingham Real Estate Professionals
Ready to Invest in Bellingham?
Bellingham Washington is one of the Pacific Northwest’s most distinctive real estate investment markets: a college town with world-class outdoor recreation access, a major healthcare employment anchor, and sustained lifestyle-driven in-migration, all operating under Washington state’s landlord-friendly legal framework. The by-bedroom student rental model near Western Washington University creates yield opportunities unavailable in most comparable markets. Fairhaven delivers lifestyle appreciation and STR income that rivals markets twice the price. Birchwood and Ferndale offer the best cash flow in the region at accessible entry points. For investors who take the time to understand its nuances, Bellingham is genuinely exceptional.
Continue Your Research
Washington State Guide
See how Bellingham compares to Seattle, Spokane, Tacoma, and other Washington markets.
Step-by-Step Invest
Complete framework for building a real estate investment strategy from scratch.
144-Lesson Course
University-level real estate education covering financing, law, strategy, and management.
For further guidance, explore our State-by-State Investor guides, browse our expert articles, or follow our Step-by-Step Investment Guide.