Fernley Real Estate Investment Guide For 2026
A comprehensive resource for investors targeting one of Nevada’s fastest-growing logistics and bedroom communities, with strong cash flow potential and direct access to the Reno-Sparks metro employment base
Quick answers: Top 5 most searched Fernley investment questions ▼
Migration data: Where people are moving from to Fernley ▼
In This Guide
Click on any section to navigate directly to that content
1. Fernley Market Overview
Market Fundamentals
Fernley sits 30 miles east of Reno on Interstate 80, positioned at the intersection of two powerful economic forces: the Reno-Sparks metro’s technology and logistics boom, and Nevada’s own industrial expansion along the I-80 corridor. What was once a small agricultural town has transformed into one of Nevada’s fastest-growing communities, driven by warehouse and distribution investment that has made the area a logistics hub for the western United States.
Key economic indicators defining Fernley’s investment case:
- Population: ~22,000 city, 60,000+ Lyon County, growing 3 to 4% annually
- Major Employers: Amazon Fulfillment Center, Dollar General Distribution Center, Trex Company, Barrick Gold, various I-80 corridor warehousing and logistics
- Proximity: 30 miles to Reno, 25 miles to Sparks, 35 miles to Tesla Gigafactory
- Median Household Income: $68,000 to $75,000, stable blue-collar base
- Job Growth: Industrial employment growing 4 to 6% annually as new distribution centers open
- No State Income Tax: Nevada advantage applies to all residents and investors
- Vacancy Rate: Under 5% for single-family rentals, tight supply vs. growing workforce
Fernley’s economy is not tech-dependent like Reno’s, giving it a different risk profile. Logistics and distribution employment tends to be more stable and recession-resistant than office-based tech work. Amazon and Dollar General do not move their distribution centers the way tech companies shift headcount. This employment stability creates reliable, long-term rental demand.
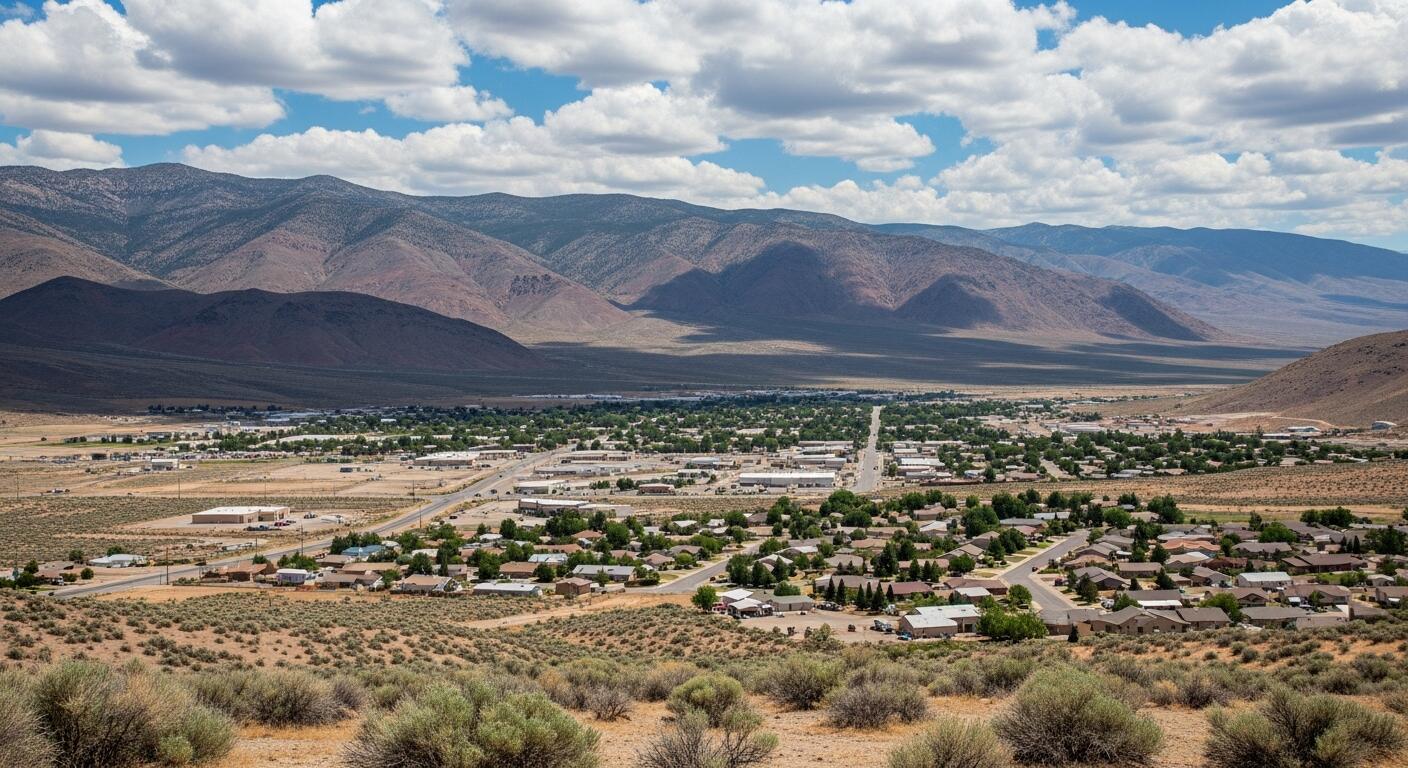
Fernley’s position on the I-80 corridor makes it a logistics hub and an affordable alternative to the Reno-Sparks metro
2026 Economic Outlook
- Continued I-80 corridor logistics expansion attracting new distribution centers
- Tesla Gigafactory production scaling drawing more supplier and worker migration
- Reno tech employment growth pushing workers to Fernley for affordability
- Lyon County infrastructure investment improving roads and utilities
- New retail and service sector following residential population growth
Investment Climate
Fernley offers something increasingly rare in the western United States: a genuine positive cash flow opportunity with real appreciation potential. Most markets force investors to choose one or the other. Fernley’s combination of affordable entry prices, strong rental demand from a growing workforce, Nevada’s landlord-friendly legal environment, and proximity to a major metro employment base creates a compelling case for both cash flow and total return investors.
- Cash flow positive or neutral with conventional 25% down financing, unlike most Reno or Las Vegas properties
- Low regulatory burden with no rent control, straightforward eviction process, and no city-specific ordinances layered on state law
- Long-term appreciation runway as Reno metro growth continues to push workforce housing demand east
- Stable tenant profile with logistics and industrial workers representing consistent, long-term renters
- New construction pipeline meeting some demand while also confirming developer confidence in market fundamentals
The primary risk in Fernley is concentration, specifically heavy dependence on a small number of large employers. If Amazon significantly downsizes or automates its Fernley operations, the local rental market would feel it. Investors should monitor employer diversity and avoid concentrating heavily in properties immediately adjacent to a single industrial campus.
Historical Performance
| Period | Market Driver | Avg Annual Appreciation | Key Event |
|---|---|---|---|
| 2010-2014 | Post-recession recovery, early logistics growth | 3-5% | Amazon opens first Fernley distribution center |
| 2015-2019 | Tesla Gigafactory announcement, Reno tech boom spillover | 6-9% | Reno prices double, Fernley demand accelerates |
| 2020-2022 | Pandemic logistics boom, California migration surge | 12-18% | E-commerce explosion supercharges industrial employment |
| 2023-2024 | Rate normalization, steady demand | 4-7% | Market stabilizes at higher base, inventory remains tight |
| 2025-2026 | New industrial investment, Reno overflow demand | 6-9% (projected) | Dollar General DC expansion, continued I-80 corridor growth |
Fernley’s 15-year track record shows consistent appreciation driven by structural employment growth, not speculative demand. A $200,000 Fernley property purchased in 2010 would be worth approximately $450,000 to $500,000 today. Unlike markets driven by sentiment, Fernley’s growth is tied to real industrial infrastructure investment that does not reverse quickly.
Demographic Trends Driving Demand
- Logistics Industry Expansion – Amazon, Dollar General, and smaller distribution operations continue hiring, creating a steady pipeline of new residents who need rental housing before committing to purchase
- California Exit Migration – Sacramento-area and Bay Area residents seeking affordable Nevada communities with access to western employment hubs, drawn by zero state income tax
- Reno-Sparks Price Overflow – As Reno median prices exceed $500,000, working-class and middle-income households are pushed east to Fernley where $350,000 buys a real home
- Tesla Gigafactory Workforce – Thousands of production workers, many earning $20 to $35 per hour, cannot afford Sparks rents and look to Fernley for housing
- Young Families – Fernley’s school quality, space, and affordability attract families from urban Nevada and California who represent stable, long-term tenants
- Remote Workers – Post-pandemic remote workers from California and Oregon who want Nevada’s tax advantages without a major city cost of living
📚 New to real estate investing? Master the fundamentals with our professional course Learn more →
2. Neighborhood Hotspots
Fernley Investment Neighborhood Map
Interactive map of Fernley’s investment neighborhoods. Green stars show top hotspots, blue circles mark established markets, and orange circles highlight emerging areas.
Core Investment Neighborhoods
Detailed Submarket Analysis: Fernley Area Neighborhoods
| Neighborhood | Price Range (SFH) | Cap Rate | Growth Drivers | Best Strategy |
|---|---|---|---|---|
| Cottonwood / Central | $320K-$380K | 6.0-7.0% | Established community, school access, central location | Buy-and-hold, family rental |
| Industrial Corridor / East | $280K-$350K | 6.5-8.0% | Amazon DC, Dollar General DC, logistics employment | Maximum cash flow, logistics worker rental |
| New Subdivisions / South | $370K-$430K | 5.5-6.5% | New construction quality, Reno commuters, remote workers | Quality tenant focus, low maintenance |
| Downtown Fernley | $270K-$340K | 6.0-7.5% | Walkability, older stock with renovation potential | Value-add, BRRRR |
| Fernley Estates | $330K-$400K | 5.5-6.5% | Larger lots, family demographic, stable tenants | Long-term family rental, appreciation hold |
| Silver Springs Area | $200K-$280K | 7.0-9.0% | Affordability, thin but loyal rental base | Maximum yield, patient investor, value-add |
Expert Insight: “The most overlooked opportunity in Fernley right now is the industrial corridor east of downtown. Properties within a 10-minute drive of the Amazon and Dollar General distribution centers consistently achieve the highest cap rates in the market because logistics workers prioritize commute time above everything else. We are seeing some investors buy two or three properties in that zone and build a small portfolio generating genuine positive cash flow, which is nearly impossible to find in Reno proper at current prices.” – Regional investor active in Lyon County market
3. Property Types
| Investment Goal | Best Property Type | Best Neighborhoods | Minimum Capital |
|---|---|---|---|
| Maximum Cash Flow | Value-add SFH or logistics corridor home | Industrial Corridor, Downtown Fernley | $80,000+ |
| Balanced Returns | Established SFH in central location | Cottonwood, Fernley Estates | $90,000+ |
| Low Maintenance | New construction SFH | South Fernley new subdivisions | $100,000+ |
| Maximum Appreciation | New construction or growth corridor land | Northwest growth area, south subdivisions | $75,000+ |
Don’t guess the costs. Our Complete Renovation & Remodeling Cost Guide covers 400+ pages of project-by-project breakdowns with real contractor pricing ranges.
4. Cost Analysis
Acquisition Cost Breakdown (Fernley)
| Expense Item | Typical Cost | Example ($350,000 Property) | Notes |
|---|---|---|---|
| Down Payment | 25% (investment) | $87,500 | Standard for investment property conventional financing |
| Closing Costs | 2-3% of price | $7,000-$10,500 | Title, escrow, lender fees, recording. Nevada closing costs are reasonable. |
| General Inspection | $350-$500 | $400 | Desert climate means HVAC and roof are priority items |
| Well and Septic Inspection | $400-$800 | $500 | Critical for properties outside city utilities. Fernley has a mix of city-serviced and well/septic properties. |
| Initial Repairs / Updates | 0-8% of price | $0-$28,000 | Highly variable. Older homes often need paint, flooring, appliances minimum. |
| Reserves (6 months) | 6 months expenses | $8,000-$12,000 | Emergency fund. HVAC replacement is the most common large expense in desert properties. |
| TOTAL MINIMUM ENTRY | ~28-32% of value | $103,400-$138,500 | Accessible entry vs. Reno or Las Vegas equivalent |
Sample Cash Flow Analysis: Cottonwood Area 3-Bedroom Single-Family
| Item | Monthly | Annual | Notes |
|---|---|---|---|
| Gross Rent | $1,750 | $21,000 | 3BR, Cottonwood area, updated |
| Less Vacancy (5%) | -$88 | -$1,050 | Conservative; Fernley vacancy is often lower |
| Property Taxes | -$262 | -$3,150 | ~0.9% of $350K assessed value. Lyon County rate. |
| Insurance | -$110 | -$1,320 | Landlord policy. Nevada rates are moderate. |
| Property Management (9%) | -$158 | -$1,890 | Fernley management fees typically 8-10% of collected rent |
| Maintenance + CapEx (8%) | -$140 | -$1,680 | Desert climate: HVAC the main expense. Lower than wet climates. |
| Net Operating Income | $992 | $11,910 | Before mortgage |
| Mortgage ($350K, 25% down, 6.75%, 30yr) | -$853 | -$10,236 | Principal and interest on $262,500 loan |
| MONTHLY CASH FLOW | +$139 | +$1,674 | Positive cash flow. Rare in western US at current rates. |
| Cap Rate | 3.40% | NOI / Purchase Price | |
| Cash-on-Cash Return | 1.9% | Annual cash flow / total cash invested (~$87,500) | |
| Total Return (7% appreciation) | ~30% | Including equity, appreciation, principal paydown, cash flow |
This example demonstrates Fernley’s core investment appeal: positive monthly cash flow with conventional financing at a $350,000 purchase price. In Reno at $530,000, the same calculation produces negative $400 to $600 per month. For investors who need their properties to pay for themselves, Fernley offers what the broader Nevada market cannot.
Expert Insight: “Fernley is the answer for investors who have been priced out of Reno but want Nevada’s legal environment and the same regional economic fundamentals. You get better cap rates, positive cash flow at current interest rates, and the same tenant pool that works in Reno but cannot afford Reno rents. The 30-minute commute to the Tesla Gigafactory alone is generating significant rental demand in the $1,600 to $1,900 range that shows no signs of softening.” – Active Lyon County investor and property manager
5. Legal Framework
✅ Investor-Friendly Environment
Nevada is consistently ranked among the most landlord-friendly states in the country, and Lyon County adds no additional complexity beyond state law. Fernley investors benefit from a fast eviction process, no rent control, no source-of-income requirements, and no city-specific ordinances. This is a straightforward operating environment compared to California, Oregon, or Washington markets.
Nevada Landlord-Tenant Law Key Points
- Summary Eviction Process: Nevada uses a summary eviction process that bypasses formal court proceedings for non-payment. Serve a 7-day notice to pay or quit. If tenant does not comply, file a summary eviction with the Justice Court. No extended timelines like California or Oregon.
- No Rent Control: Nevada preempts local rent control ordinances statewide. Lyon County and the City of Fernley cannot impose rent control. Landlords may raise rent with proper notice.
- Rent Increase Notice: 45 days written notice required for periodic tenancy rent increases. For fixed-term leases, increases take effect at renewal.
- Security Deposit Limit: Maximum 3 months’ rent. Must return within 30 days of tenant departure with itemized statement of deductions.
- Repair Obligations: Landlord must keep units habitable. Tenant may deduct repair costs (up to one month’s rent) if landlord fails to repair after 14-day written notice.
- Entry Notice: 24-hour advance notice required for non-emergency entry. No specific time restrictions beyond reasonableness.
- No Just Cause Requirement: Nevada does not require just cause for eviction at end of lease term. Standard 30-day notice for month-to-month tenancies.
Lyon County and Fernley Specific Rules
- No Local Rent Control: Lyon County and Fernley follow Nevada state law. No additional tenant protections.
- Business License: Rental property operators in Fernley may need a city business license. Verify current requirements with the City of Fernley before operating.
- Short-Term Rentals: Nevada allows short-term rentals with registration. Lyon County has its own STR ordinance requiring registration and compliance with health and safety standards. Verify current permit requirements.
- Well and Septic Compliance: Properties on wells or septic must meet Lyon County environmental health standards. Annual inspections may be required for certain properties.
- HOA Rules: Some Fernley subdivisions have HOAs that may restrict rentals, short-term use, or property modifications. Always review CC&Rs before purchasing in an HOA community.
Useful Fernley Resources
- City of Fernley: cityoffernley.org
- Lyon County Assessor: lyon-county.org/assessor
- Nevada Justice Court (evictions): nevadajudiciary.us
- Nevada Real Estate Division: red.nv.gov
| Regulation | Nevada / Fernley Requirement | California Comparison | Investor Impact |
|---|---|---|---|
| Eviction Timeline | 7-day notice, summary process, 2-4 weeks total | 60-90+ days minimum | Dramatically faster resolution, lower legal costs |
| Rent Control | None. State preempts local ordinances. | Statewide AB 1482, 5% + CPI cap | Full market rent adjustment flexibility |
| Rent Increase Notice | 45 days | 90 days for 10%+ increases | Standard timeline, shorter than California |
| Security Deposit | Up to 3 months rent, return in 30 days | 2 months (unfurnished), 21 days return | More upfront protection available |
| Screening | Landlord discretion within fair housing law | Source of income protection in many cities | More flexibility in tenant selection |
| State Income Tax | None | Up to 13.3% | Significant improvement to after-tax returns for California investors |
6. Step-by-Step Fernley Investment Playbook
Define Your Fernley Strategy
Fernley is unusual among Nevada markets in that multiple investor strategies work well simultaneously. Choose the approach that matches your capital, risk tolerance, and involvement level:
Logistics Worker Cash Flow
Buy near the industrial corridor. Rent to Amazon and Dollar General employees who prioritize commute time and pay reliably. Simplest strategy with the highest cap rates in the market.
Reno Overflow Buy-and-Hold
Target families and Reno commuters who cannot afford Reno prices. Focus on established neighborhoods with school access. Balanced returns with strong appreciation potential as the metro grows.
Value-Add BRRRR
Buy dated 1980s and 1990s homes in downtown Fernley or older Cottonwood stock. Renovate to increase rents and value. Refinance out equity. Lower entry prices make full capital recovery more achievable than in Reno.
New Construction Hold
Buy new construction for low maintenance and quality tenant attraction. Slightly lower cap rates offset by reduced capital expenditure risk and better tenant quality. Ideal for out-of-state passive investors.
Build Your Fernley Team
Fernley is a small market. Your team quality matters more here than in Reno or Las Vegas because fewer options exist and local knowledge is harder to find remotely. Essential team members:
- Lyon County Specialist Real Estate Agent: Must have closed investment transactions in Fernley specifically. Reno agents often lack deep Lyon County knowledge. Ask how many Fernley investment sales they have closed in the past 12 months.
- Property Manager with Fernley Presence: Some Reno-based managers cover Fernley. Verify they have current rentals actively managed in the city and understand the industrial worker tenant demographic.
- Licensed General Contractor: For value-add plays, a Nevada-licensed contractor with Lyon County permit experience. Desert renovation has different considerations than coastal markets.
- Well and Septic Inspector: If buying outside city utilities, hire an independent well and septic specialist, not just the general inspector. Lyon County Environmental Health requirements are specific.
- Nevada Real Estate CPA: For entity structuring, depreciation strategy, and Nevada-specific considerations including no state income tax optimization.
Fernley-Specific Due Diligence
Physical Due Diligence
- HVAC inspection and remaining life estimate. Desert climate stresses cooling systems heavily.
- Roof condition. High UV exposure and occasional high-wind events in the valley.
- Well water quality test if on well water. Iron and mineral content can be high.
- Septic system inspection and pumping records if on septic.
- Foundation and grading. Desert soil expansion and flooding risk in low-lying areas.
- Insulation levels. Old Nevada homes are often under-insulated for heating costs.
Market Due Diligence
- Verify employer stability: confirm the specific distribution centers near any target property are actively operating and hiring.
- Check HOA rules and rental restrictions in any planned subdivision.
- Confirm city utilities vs. well/septic status. Affects operating costs significantly.
- Verify zoning allows intended use, especially for any STR or multi-unit plans.
- Check flood zone status. Portions of the Fernley valley have historic flooding history.
- Review comparable rental listings and vacancy to validate rent projections.
Acquiring and Managing in Fernley
Fernley is a thinner market than Reno. Key acquisition and management considerations:
- Act decisively: Quality Fernley properties priced accurately move quickly. Out-of-state buyers who take weeks to decide lose to local investors who can move in days. Get pre-approved and set a clear decision threshold before making offers.
- Price-to-rent verification: Run your own rental comps independently of the seller or listing agent. Zillow and Rentometer are less reliable in smaller markets. Your property manager should pull current active listings.
- Tenant marketing channels: Fernley’s workforce responds to Facebook Marketplace, Indeed, and physical signage more than Apartments.com. Understand where your target tenant looks for housing.
- Lease terms: 12-month leases are standard. Nevada’s landlord-friendly environment means you do not need to offer concessions typical in larger urban markets.
- Utility setup: Clarify which utilities are tenant-paid. Fernley’s desert climate means summer cooling costs are significant. Most investors pass utilities to tenants for single-family homes.
7. Financing Options for Fernley
| Loan Type | Down Payment | Rate Premium | Best For | Fernley Note |
|---|---|---|---|---|
| Conventional Investment | 25% | +0.5-0.75% | Strong W-2 income, good credit | Most Fernley properties are well within conforming loan limits. Standard product works. |
| DSCR Loan | 20-25% | +1.0-2.0% | Self-employed, multiple properties, no income docs | Fernley cap rates often qualify. Unlike Reno, DSCR can work here at 1.0x+ coverage. |
| House Hacking (FHA) | 3.5% | Standard + MIP | Owner-occupying one unit of duplex | Limited duplex supply in Fernley but viable where found. Best first-step entry. |
| Portfolio Loan | 20-30% | +1-2% | Multiple properties, blanket financing | Nevada state banks and credit unions. Good for building a small Fernley portfolio efficiently. |
| Hard Money (Bridge) | 15-25% | 9-13% rate | Value-add acquisitions, BRRRR execution | Reno-based hard money lenders active in Lyon County. Short term only. |
| Conventional Owner-Occupied | 5-10% | Standard rate | Moving to Fernley and buying primary residence with rental intent after 1 year | Many California migrants use this approach. Live in the home one year then convert to rental. |
Fernley Financing Advantage: Unlike Reno or Las Vegas where most investment properties do not qualify for DSCR financing due to low cap rates, Fernley’s 6 to 8% cap rates frequently produce debt service coverage ratios above 1.0x at current interest rates. This means more financing options are available to Fernley investors, including products that do not require income documentation. Always run the numbers with your specific property before assuming DSCR qualification, but the odds are meaningfully better here than in any other major Nevada market.
8. Frequently Asked Questions

Knowledge Quiz: Fernley Real Estate Investment
Open Quiz
5 quick questions on what you just learned about Fernley investing
1) What is Fernley’s primary advantage over Reno for real estate investors in 2026?
Answer: B
The guide’s cash flow analysis shows a Fernley property at $350,000 generating approximately +$139 per month with 25% down at 6.75% interest. A comparable Reno property at $530,000 would typically produce negative $300 to $600 per month at the same terms. This positive cash flow in a western US market is rare and is Fernley’s defining investment advantage.
2) Which Fernley neighborhood does the guide identify as having the highest cap rates due to employer proximity?
Answer: C
The Industrial Corridor east of downtown Fernley sits near the Amazon and Dollar General distribution centers. Logistics workers prioritize commute time, creating concentrated rental demand in that zone. The guide shows cap rates of 6.5 to 8.0% in the industrial corridor, the highest in the Fernley market.
3) How long does Nevada’s summary eviction process typically take for a non-payment case in Fernley?
Answer: A
Nevada’s summary eviction process allows landlords to bypass formal court proceedings for straightforward non-payment cases. The 7-day notice plus Justice Court filing plus Constable execution typically completes in 3 to 4 weeks for uncontested cases. This is dramatically faster than California (60 to 120+ days) and is one of Nevada’s major advantages for landlords.
4) What specific due diligence item does the guide call out as critical for Fernley properties outside city utilities?
Answer: D
The guide specifically calls out that Fernley has a mix of city-serviced and well/septic properties, and that an independent well and septic specialist should be hired for any property outside city utilities. Lyon County Environmental Health has specific requirements, and water quality tests for iron and mineral content are recommended. This is distinct from urban Nevada markets where municipal water is standard.
5) Why does the guide say DSCR loans work better in Fernley than in Reno?
Answer: B
DSCR loans require rental income to cover debt service at 1.0x or better. Reno’s cap rates of 4 to 5.5% combined with current mortgage rates typically produce coverage ratios below 1.0x, disqualifying most Reno properties. Fernley’s cap rates of 6 to 8% more frequently produce coverage ratios above 1.0x, meaning investors without W-2 income documentation have more financing options in Fernley than in any other major Nevada market.
Work With a Local Expert in Fernley
We are building a verified network of real estate professionals across every market we cover.

About Our Expert Network
We are finalizing partnerships with verified real estate professionals across every market featured on Builds and Buys. Each expert in our network is selected for their hands-on investment experience, local market knowledge, and commitment to helping buyers and investors make sound decisions.
Our local specialists offer:
- Proven experience with investment and income-producing properties
- Deep knowledge of local pricing, rental yields, and neighborhood dynamics
- Guidance on financing, legal structure, and due diligence
- Access to off-market and pre-market opportunities
- Full transaction support from search through closing
- Ongoing portfolio and property management referrals
Services Covered
- Property sourcing and acquisition
- Investment analysis and underwriting
- Buyer representation
- Market comparables and valuations
- Short-term and long-term rental strategy
- Value-add and renovation guidance
- Legal and title referrals
- Financing and lender connections
- Property management referrals
- Insurance and inspection referrals
- 1031 exchange coordination
- Exit strategy planning
Get Connected or Join Our Network
Looking for a local expert to help with your investment? Reach out and we will connect you with the right professional for your market and strategy.
Are you a real estate professional with a track record working with investors? We are always expanding our network of verified local experts.
Contact us at support@buildsandbuys.com
Find Specialized Fernley Real Estate Professionals
Ready to Invest in Fernley?
Fernley is one of the most straightforward investment cases in the western United States. Affordable entry prices, positive cash flow with conventional financing, Nevada’s landlord-friendly legal environment, and a growing logistics employment base create a combination that is genuinely difficult to find anywhere else in the region. Investors who act on Fernley today are buying into a market that is still early in its growth cycle relative to Reno but shares the same regional economic engine. The window for sub-$400,000 cash-flowing properties in this corridor will not stay open forever.
Continue Your Research
Nevada State Guide
See how Fernley compares to Las Vegas, Reno, and other Nevada markets across the state.
Step-by-Step Invest
Complete framework for building a real estate investment strategy from scratch.
144-Lesson Course
University-level real estate education covering financing, law, strategy, and management.
For further guidance, explore our State-by-State Investor guides, browse our expert articles, or follow our Step-by-Step Investment Guide.