Riverside Real Estate Investment Guide For 2026
A comprehensive resource for investors targeting the Inland Empire’s largest city and county seat, where UC Riverside’s 25,000+ students, a massive logistics economy, historic neighborhoods undergoing revival, and Southern California’s best cash flow ratios combine to create one of the most compelling yield-focused investment markets in all of California for 2026
Quick answers: Top 5 most searched Riverside investment questions ▼
Migration data: Where people are moving from to Riverside ▼
In This Guide
Click on any section to navigate directly to that content
1. Riverside Market Overview
Market Fundamentals
Riverside is the Inland Empire’s anchor city: the county seat of Riverside County, a UC campus city, a logistics hub, and the historic center of Southern California’s citrus legacy. With a population exceeding 320,000 and a genuinely diversified economy spanning higher education, logistics and warehousing, healthcare, government services, and manufacturing, Riverside offers the most compelling cash-flow investment profile of any major Southern California city in 2026.
The city’s investment case rests on a simple but powerful proposition: Riverside’s rent-to-price ratios allow investors to achieve cash flow neutrality or positive cash flow with conventional financing, a feat that is essentially impossible in Los Angeles, San Diego, or Orange County at comparable quality levels. This is not a rural or distressed market. Riverside is a legitimate urban center with a Research I university, a nationally recognized historic hotel, an improving downtown arts and dining scene, and a strategic logistics position at the intersection of the I-10 and I-215 freeways.
Key economic indicators:
- Population: 320,000+, largest city in Riverside County
- Major Employers: UC Riverside (25,000+ students, 5,000+ employees), Riverside University Health System, Amazon fulfillment network, UPS, FedEx, Kaiser Permanente, County of Riverside government
- Median Household Income: $66,000+
- Logistics Economy: Riverside County is the third-largest logistics employment hub in the United States, generating 200,000+ warehousing and distribution jobs
- Vacancy Rate: Under 4.5% citywide
- Median Home Price: $560,000, significantly below coastal California averages
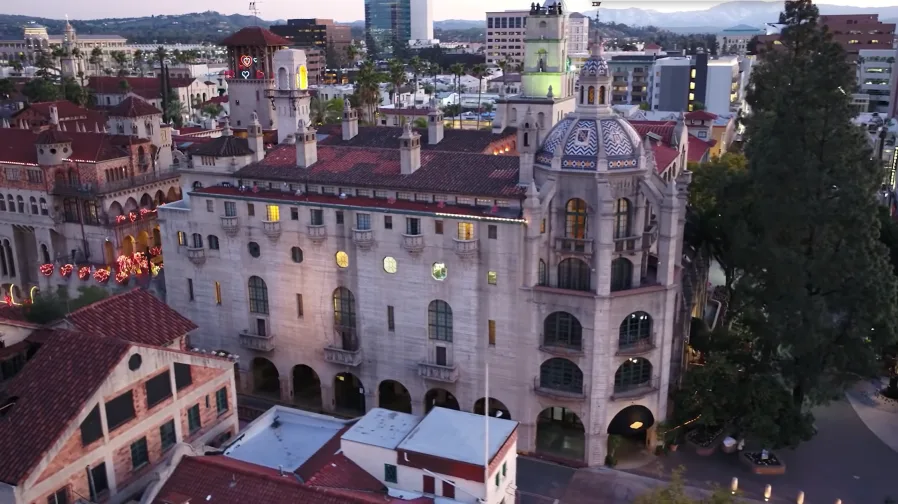
The Mission Inn Hotel anchors downtown Riverside’s revival and symbolizes a city with genuine historic character and economic ambition
2026 Economic Outlook
- UCR expansion adding new engineering and health sciences facilities, growing enrollment toward 30,000
- Downtown Riverside arts and dining revival accelerating with new investment in the Seventh Street and Main Street corridors
- Inland Empire logistics economy maintaining record employment levels despite automation adjustments
- March Air Reserve Base civilian expansion adding regional employment
- Metrolink rail improvements reducing LA commute times and increasing Riverside’s appeal to remote-first workers
Why Riverside Outperforms for Cash Flow
The cash flow advantage in Riverside versus coastal California markets is not incremental, it is structural. Understanding why helps investors make the case for allocation:
| Market | Median SFH Price | Typical 3BR Rent | Gross Rent Multiplier | Approx Cap Rate |
|---|---|---|---|---|
| Riverside | $560,000 | $2,400-$2,800 | 16-19x | 5.5-6.5% |
| Los Angeles | $850,000 | $3,200-$3,800 | 22-26x | 3.0-4.0% |
| San Diego | $900,000 | $3,400-$4,000 | 22-26x | 3.0-4.2% |
| Orange County | $1,100,000 | $3,800-$4,500 | 24-28x | 2.5-3.5% |
| Riverside (UCR area) | $620,000 | $2,800-$3,200 | 16-18x | 5.0-6.0% |
The Gross Rent Multiplier (GRM) comparison tells the story clearly. Riverside properties trade at 16-19x annual rent while comparable LA and OC markets trade at 22-28x. This compression means that the same quality property and tenant generates dramatically more income relative to its acquisition cost in Riverside, making the difference between deeply negative and near-neutral cash flow under the same financing conditions.
Historical Performance
| Period | Market Driver | Avg Annual Appreciation | Key Event |
|---|---|---|---|
| 2010-2014 | Post-recession recovery; Inland Empire logistics boom begins | 5-9% | Amazon announces first Inland Empire fulfillment center; UCR expands enrollment |
| 2015-2019 | LA/OC affordability crisis drives Inland Empire demand surge | 8-13% | Downtown Riverside Mission Inn District revival begins; Canyon Crest becomes recognized premium market |
| 2020-2022 | Pandemic remote work surge; logistics employment at all-time high | 18-28% | Riverside median home price rises 50%+ in 24 months; inventory near zero across all sub-markets |
| 2023-2024 | Rate shock; Inland Empire more affected than coastal markets due to first-time buyer sensitivity | 0-3% | Values hold well in UCR and Canyon Crest; some softening in outer suburban corridors |
| 2025-2026 | Rate stabilization; continued LA/OC migration; UCR expansion | 5-9% (projected) | Downtown Riverside arts district achieving critical mass; logistics employment stabilizing at record levels |
Demographic Trends Driving Demand
- UC Riverside Student Population – UCR’s 25,000+ students create one of the most reliable and growing rental demand bases in Southern California. UCR has been adding enrollment annually and has been designated a Hispanic-Serving Institution, reflecting its importance to the broader Southern California community. The university’s off-campus housing shortage consistently keeps occupancy near 100% in properties near campus.
- Logistics Economy Workforce – Riverside County is home to the largest concentration of Amazon fulfillment centers in the United States, plus major UPS, FedEx, and third-party logistics operations. This sector employs 200,000+ workers in Riverside and adjacent San Bernardino County, creating enormous working-class and lower-middle-class rental demand across all of Riverside’s sub-markets.
- LA and OC Affordability Migration – The continued elevation of LA and OC home prices drives a steady stream of households who are choosing to live in Riverside while commuting to coastal employment, or transitioning to local employment to escape the commute entirely. This migration pressure has been consistent for over a decade and is expected to continue as coastal prices show no signs of reversing.
- Healthcare Sector – Riverside University Health System, Kaiser Permanente Riverside, and numerous specialty clinics collectively employ thousands of healthcare professionals who form a stable middle-income renter base throughout the city.
- Government Employment Base – As the county seat of California’s fourth-largest county, Riverside hosts substantial county, state, and federal government employment, creating a stable public-sector renter base that is less sensitive to private-sector economic cycles.
- Historic Neighborhood Appeal – Riverside’s Wood Streets neighborhood, Mission Inn District, and other historic areas attract a creative-class and professional demographic that has been absent from the city’s identity historically. This new demographic layer is gradually diversifying the tenant pool beyond the traditional working-class and student renters.
📚 New to real estate investing? Master the fundamentals with our professional course Learn more →
2. Neighborhood Hotspots
Riverside Investment Neighborhood Map
Interactive map of Riverside’s investment neighborhoods. Green stars show top hotspots, blue circles mark established markets, and orange circles highlight emerging areas.
Core Investment Neighborhoods
Detailed Submarket Analysis: Riverside Neighborhoods
| Neighborhood | Price Range | Cap Rate | Growth Drivers | Best Strategy |
|---|---|---|---|---|
| Canyon Crest / UCR | $600K-$900K | 4.5-5.5% | UCR campus proximity, academic demand, prestige | Best appreciation, academic rental, professional tenants |
| Wood Streets Historic | $500K-$800K | 5.0-6.5% | Historic character, downtown revival, creative class | Value-add craftsman, appreciation, character rental |
| University District | $500K-$750K | 5.5-7.0% | Student demand, near-campus, academic calendar | Student rental, highest UCR-area yield, multi-family |
| Mission Grove | $550K-$800K | 4.8-5.8% | Family stability, schools, Metrolink access | LA commuter rental, family SFH, long-term hold |
| La Sierra | $450K-$680K | 5.5-7.0% | La Sierra University, affordability, freeway access | Best cash flow, BRRRR, value-add multi-family |
| Alessandro Heights | $750K-$1.5M+ | 3.5-4.5% | Prestige, views, affluent demographic | Luxury appreciation, long-term wealth preservation |
| Downtown / Mission Inn | $450K-$750K | 5.0-6.5% | Urban revival, Mission Inn, young professionals | Urban appreciation, mixed-use, revival play |
| Orangecrest | $580K-$820K | 4.5-5.5% | Good schools, family demand, healthcare workers | Suburban family SFH, low intensity management |
| Hunter Park | $380K-$580K | 6.5-8.5% | Logistics worker demand, lowest Riverside prices | Highest yield, experienced management required |
| Eastside Corridor | $420K-$640K | 6.0-7.5% | Value-add inventory, transitional, improving | BRRRR, value-add, improving demographics |
Expert Insight: “The Wood Streets neighborhood is where I am putting my own money in Riverside right now. It reminds me of what North Park in San Diego looked like in 2009 or what Silver Lake in LA looked like around 2005. You have historic craftsman homes, a genuine neighborhood identity, proximity to a revitalizing downtown, and prices that are still in the range where the cash flow math works. The risk is timing. The transformation will happen because the fundamentals are all there. Whether it takes 5 years or 10 years is uncertain. But at these entry prices you are being paid a reasonable yield to wait.” – James Torres, Principal, Inland Empire Value Investors
3. Property Types
| Investment Goal | Best Property Type | Best Neighborhoods | Minimum Capital |
|---|---|---|---|
| Maximum Cash Flow in CA | Multi-family or SFH+ADU | Hunter Park, La Sierra, Eastside, University District | $95,000+ |
| Best Appreciation | Canyon Crest SFH or academic rental | Canyon Crest, Wood Streets, Mission Grove | $150,000+ |
| Best BRRRR in California | Value-add SFH or duplex | La Sierra, Eastside, Hunter Park, Arlanza | $95,000+ |
| Positive Cash Flow | SFH with ADU or multi-family | University District, La Sierra, Wood Streets | $125,000+ |
Don’t guess the costs. Our Complete Renovation & Remodeling Cost Guide covers 400+ pages of project-by-project breakdowns with real contractor pricing ranges.
4. Cost Analysis
Acquisition Cost Breakdown (Riverside)
| Expense Item | Typical Cost | Example ($560,000 Property) | Notes |
|---|---|---|---|
| Down Payment | 25% (investment) | $140,000 | Standard for California investment; falls under Riverside County conforming limit |
| Closing Costs | 2-3% of price | $11,200-$16,800 | Title, escrow, lender fees, Riverside County transfer tax |
| General Inspection | $350-$550 | $450 | Full inspection; Riverside heat makes HVAC condition particularly important |
| Termite Inspection | $150-$300 | $200 | Inland Empire termite activity can be significant; subterranean termites common |
| Lead/Asbestos (pre-1978) | $300-$500 | $350 | Mandatory disclosure; Eastside and older Riverside neighborhoods commonly affected |
| Initial Repairs | 0-8% of price | $0-$44,800 | Variable; value-add properties in Eastside and La Sierra often need significant work |
| Reserves (6 months) | 6 months operating expenses | $8,000-$13,000 | Emergency fund for vacancy, repairs, and California compliance costs |
| TOTAL MINIMUM ENTRY | ~27-30% of value | $160,000-$215,000 | Most accessible major California investment market outside the Central Valley |
Sample Cash Flow Analysis: University District SFH (Near UCR)
| Item | Monthly | Annual | Notes |
|---|---|---|---|
| Rent (4BR near UCR) | $3,000 | $36,000 | 4BR near UCR, leased to 4 graduate students at $750/room |
| Less Vacancy (3%) | -$90 | -$1,080 | Very low for UCR-adjacent properties; summer gap partially filled |
| Property Taxes | -$547 | -$6,563 | ~1.05% of $625K assessed value (purchase + minor upgrades) |
| Insurance | -$145 | -$1,740 | Landlord policy; student housing riders recommended |
| Property Management (10%) | -$300 | -$3,600 | UCR-experienced PM preferred |
| Maintenance + CapEx | -$300 | -$3,600 | Higher than average for student rentals |
| Net Operating Income | $1,618 | $19,417 | Before mortgage |
| Mortgage ($625K total, 25% down, 6.75%, 30yr) | -$3,051 | -$36,612 | P&I on $468,750 loan (under Riverside County conforming limit) |
| CASH FLOW | -$1,433 | -$17,195 | Near-neutral; dramatically better than comparable coastal CA |
| Cap Rate | 3.11% | NOI / Total Cost; improves with ADU or when fully room-by-room rented | |
| Total Return (7% appreciation) | ~24% | Including equity, appreciation, principal paydown, tax benefits |
The UCR student rental scenario becomes significantly more compelling when room-by-room leasing is applied. A 4BR property near campus leased per-room at $800-$900/room generates $3,200-$3,600/month, improving cash flow by $200-$600/month versus a single-family lease. Room-by-room leasing requires more active management but is well-established in the UCR market and routinely achievable with a UCR-experienced property manager.
Positive Cash Flow Example: La Sierra Duplex
| Item | Monthly | Annual | Notes |
|---|---|---|---|
| Unit 1 (3BR, renovated) | $2,200 | $26,400 | 3BR La Sierra, post-renovation, working family |
| Unit 2 (2BR, renovated) | $1,900 | $22,800 | 2BR La Sierra, post-renovation |
| Gross Income | $4,100 | $49,200 | |
| Less Vacancy (4%) | -$164 | -$1,968 | Conservative for La Sierra working-class market |
| Property Taxes | -$590 | -$7,080 | ~1.05% of $674K (purchase $590K + $84K renovation) |
| Insurance | -$145 | -$1,740 | Landlord policy |
| Property Management (10%) | -$410 | -$4,920 | Standard PM |
| Maintenance + CapEx | -$410 | -$4,920 | ~10% for renovated duplex |
| Net Operating Income | $2,381 | $28,572 | Before mortgage |
| Mortgage ($674K total, 25% down, 6.75%, 30yr) | -$3,293 | -$39,516 | P&I on $505,500 loan |
| CASH FLOW | -$912 | -$10,944 | Near-neutral; positive after BRRRR refinance at $820K ARV recovers significant equity |
| Cap Rate | 4.24% | On total all-in cost including renovation | |
| Post-BRRRR Refi Cash Flow | +$188 | +$2,256 | After 75% LTV cash-out refi at $820K ARV, new loan ~$615K |
This is the BRRRR math that has drawn investors from Los Angeles, Orange County, and the Bay Area to Riverside’s La Sierra corridor. The pre-BRRRR purchase at $590,000 plus $84,000 renovation creates a property appraising at $820,000. A 75% LTV cash-out refinance pulls back approximately $90,000-$100,000 of invested capital while leaving the investor with a property generating slightly positive cash flow. Repeat this process and you are building equity and cash flow simultaneously, which is essentially impossible in coastal California markets at current pricing.
Expert Insight: “I have investors who started with a single $500,000 Riverside duplex in 2018 and now own seven properties producing $8,000/month in positive cash flow, all without any additional capital from outside the BRRRR cycle. That is what is possible in Riverside that is completely impossible in LA or San Diego. You simply cannot recycle equity fast enough in coastal markets because the price-to-rent ratios prevent the BRRRR math from working. In Riverside, the math works. Every single time, if you buy right and renovate efficiently.” – Angela Martinez, Founder, IE Cash Flow Investors
5. Legal Framework
✅ Riverside: California’s Most Investor-Friendly Major City Regulatory Environment
Riverside has no local rent control ordinance and is governed solely by California’s statewide AB 1482. This is the best regulatory environment available in any major Southern California city. No local registration requirements, no additional local eviction procedures beyond state law, no local screening restrictions beyond state law. For investors frustrated by the regulatory complexity of Los Angeles, Long Beach, or San Francisco, Riverside represents a dramatically simpler compliance environment while remaining a genuine urban center with strong fundamentals. Always consult a California-licensed attorney for lease compliance, but the baseline Riverside landlord experience is meaningfully less burdensome than any major coastal California city.
California AB 1482 (Statewide)
Riverside operates under California’s Tenant Protection Act of 2019 only:
- Rent Increase Cap: 5% + local CPI annually, maximum 10% per year. Applies to buildings constructed before January 1, 2007. Riverside County CPI has tracked at approximately 3-5% in recent years.
- Just Cause Eviction: After 12 months of tenancy, landlords must show just cause. At-fault causes include non-payment and lease violations. No-fault causes require one month’s rent relocation assistance.
- Vacancy Decontrol: Full market rent reset on voluntary tenant vacancy. This is the primary income recovery mechanism for pre-2007 properties.
- Exempt Properties: SFH and condos with individual owner landlords providing proper notice are exempt. Post-2007 construction exempt for 15 years. Owner-occupied 2-unit buildings exempt.
- Student Rental Consideration: 12-month academic leases that include natural lease end dates followed by voluntary non-renewal are generally treated as the tenant’s decision not to renew rather than a just-cause eviction, simplifying annual student housing turnover management.
Student Rental Best Practices
UCR student rentals require specific management approaches beyond standard residential leasing:
- Academic Calendar Leasing: Standard practice near UCR is to lease on a 12-month term starting in late August to align with the academic year. This creates natural turnover at predictable times and is familiar to UCR student renters.
- Room-by-Room Lease Structure: Individual room leases (each student signs separately for their room) can maximize income and reduce vacancy risk versus a single master lease, since departing students are individually responsible for their rooms rather than creating a full-house vacancy.
- UCR Off-Campus Housing Resources: UCR maintains an off-campus housing database and connects students with landlords. Registering your property with UCR’s off-campus housing office is a free and effective marketing tool that fills vacancies quickly.
- Security Deposit Management: California limits security deposits to 2 months’ rent for unfurnished units. Student properties should use maximum deposit and thorough move-in documentation given higher-than-average wear and tear risk.
- Parent Guarantors: For undergraduate student leases, requiring a parent co-signor (income-qualified adult guarantor) significantly reduces credit and income risk while remaining legally permissible under California’s screening criteria.
Key Resources
- Riverside City Planning: riversideca.gov/planning
- California Apartment Association: caanet.org
- UCR Off-Campus Housing: offcampus.ucr.edu
- Riverside County Assessor: rivcoacr.org
| Regulation | Riverside | Los Angeles | Investor Impact |
|---|---|---|---|
| Local Rent Control | None | Los Angeles RSO (extensive) | Dramatically simpler compliance than LA; no local registration or inspection program |
| Rent Cap | 5% + CPI, max 10% (AB 1482 only) | LA RSO: CPI only (often 3-4%) | Riverside allows significantly higher annual increases than LA’s local ordinance |
| Just Cause Eviction | After 12 months (AB 1482) | LA RSO: from day 1 of tenancy in covered units | Riverside landlords have full 12 months before just cause applies; LA landlords often have it from move-in |
| Local Registration | None required | RSO registration required for covered units | No annual registration fees or inspection requirements in Riverside |
| AB 1482 Exemptions | SFH/condo individual owner, post-2007, owner-occupied 2-unit | LA RSO has separate and often narrower exemptions | Same state exemptions apply; no additional LA-style local exemption complications |
6. Step-by-Step Riverside Investment Playbook
Choose Your Primary Strategy
Riverside supports multiple validated investment strategies. Choose the one that matches your capital, time horizon, and management capacity:
UCR Academic Rental
Acquire Canyon Crest or University District SFH. Lease to UCR students, faculty, or staff. Near-100% occupancy anchored by the academic calendar. Best appreciation in Riverside. Room-by-room leasing optional for higher yield.
La Sierra / Eastside BRRRR
California’s best BRRRR market. Acquire dated properties at $380,000-$590,000. Renovate over 4-6 months. Refinance at improved ARV and recover significant invested capital. Repeat. The price-to-rent ratios in La Sierra make BRRRR math work at a level impossible in coastal CA.
Wood Streets Appreciation Play
Buy craftsman-era homes in the Wood Streets Historic District adjacent to downtown. Accept near-neutral cash flow in exchange for positioning in a neighborhood with clear transformation momentum. The Mission Inn District revival is the catalyst; Wood Streets is the beneficiary residential neighborhood.
LA Commuter SFH
Acquire Mission Grove or Orangecrest SFH priced for LA commuter families. Metrolink access and high SoCal quality at Riverside prices. Stable family tenants with long average tenancies. Low management intensity and consistent appreciation driven by ongoing LA affordability migration.
Build Your Riverside Team
- Riverside Investor-Focused Agent: Should know the difference between a La Sierra value-add opportunity and an overpriced flip. Must understand the UCR rental market dynamics, current student rent levels, and the Wood Streets / downtown appreciation story. Ask them to walk you through their last five investment transactions specifically.
- UCR-Experienced Property Manager (if targeting academic market): Verify they maintain a relationship with UCR’s off-campus housing office. Ask how many UCR tenant placements they facilitated last year. A PM without active UCR relationships will leave canyon Crest and University District properties vacant during the brief early-summer turnover window when UCR-connected PMs are already placing students.
- Inland Empire Contractor Network: For BRRRR strategies in La Sierra and the Eastside, having 2-3 reliable renovation contractors with current Riverside availability is essential. Good Riverside contractors are busy; build relationships before you need them.
- California Landlord-Tenant Attorney: For entity structuring, AB 1482 compliance, and student lease clause review. Academic lease addendums that properly document occupancy limits and use restrictions require specific California language.
- Inland Empire CPA: For Prop 13 planning, BRRRR refinance tax treatment, and California rental income reporting requirements.
Riverside-Specific Due Diligence
Physical Due Diligence
- HVAC assessment (Riverside heat is extreme in summer; failing AC is a habitability issue)
- Foundation inspection (Inland Empire expansive soils cause movement in older homes)
- Termite inspection (subterranean termites are prevalent throughout Riverside)
- Lead and asbestos for pre-1978 properties (very common in older Eastside and Wood Streets stock)
- Electrical panel capacity for any ADU development plans
- Sewer line inspection for pre-1980 properties
- Roof condition and age (Riverside heat accelerates roof degradation)
Investment-Specific Due Diligence
- Verify AB 1482 coverage status based on build year and ownership structure
- Review current leases for rent amounts, terms, and student vs. professional tenant type
- Pull permit history for all improvements (unpermitted additions are common in older stock)
- Verify ADU eligibility with City of Riverside Building Department for any ADU plan
- Research nearest UCR buildings and walking/biking time for academic market properties
- Check proximity to logistics employment centers for working-class rental properties
- Verify Metrolink station walking distance for LA commuter targeted properties
Competing in the Riverside Market
- Canyon Crest is competitive: Desirable Canyon Crest properties attract multiple offers. Pre-inspection before submitting allows non-contingent clean offers. The UCR buyer base (faculty, staff purchasing) adds a layer of competition that does not exist in most Inland Empire markets.
- La Sierra BRRRR requires off-market access: The best La Sierra value-add properties sell quickly when listed. Building relationships with listing agents who specialize in this corridor and identifying estate/trust sales before they hit the MLS are the primary competitive advantages for BRRRR investors.
- Pricing against logistics employment: When evaluating working-class neighborhoods, verify whether Amazon, UPS, or other logistics employers are within practical commute distance. Properties near logistics employment centers command 5-10% rent premiums and have lower vacancy rates than comparable properties without this employment access.
- Summer UCR timing: The best time to acquire UCR-adjacent properties is late spring and early summer when the property may be temporarily vacant between academic years. Sellers who are not familiar with the cyclical UCR rental market sometimes underprice summer-vacant properties that will be re-leased in August.
- Downtown appreciation timing: The Wood Streets and downtown corridor is in the early stages of transformation. Properties here currently reflect some of the city’s better yields because the market has not yet fully priced in the transformation premium. Patient investors who acquire now are buying the narrative before it becomes market consensus.
7. Financing Options for Riverside
| Loan Type | Down Payment | Rate Premium | Best For | Riverside Note |
|---|---|---|---|---|
| Conventional Investment | 25% | +0.5-0.75% | Most Riverside SFH and multi-family under $806,500 | Riverside County conforming limit is $806,500; covers the vast majority of Riverside investment purchases without requiring jumbo. This is standard for most acquisitions. |
| DSCR Loan | 25-30% | +1.5-2.5% | Higher-yield properties where rental income covers debt service | Riverside is one of the few Southern California markets where DSCR loans commonly qualify at 1.0x+ DSCR. La Sierra multi-family, Hunter Park SFH, and University District properties can meet DSCR requirements. This makes Riverside accessible to investors who prefer not to document personal income. |
| FHA House Hack | 3.5% | Standard + MIP | Owner-occupying one unit of 2-4 unit property | Riverside County FHA limits cover most 2-4 unit acquisitions. Combined with Riverside’s superior rent-to-price ratios, the FHA house hack in La Sierra or University District can produce genuinely positive cash flow from day one. |
| Hard Money / Bridge | 15-25% | 8-12% rate | BRRRR acquisitions requiring speed and flexibility | Multiple Inland Empire hard money lenders active in Riverside. Essential for competitive BRRRR acquisitions in La Sierra and Hunter Park where the best deals go quickly. |
| Portfolio Loan | 20-30% | +1-2% | Multiple properties, self-employed investors scaling portfolios | Several Inland Empire-focused community banks and credit unions offer portfolio products suited to multi-property Riverside investors. |
| ADU Construction / HELOC | 20-25% of total | +1-2% | Post-purchase ADU development to improve cash flow | HELOC or cash-out refinance after 12 months is the lowest-cost ADU financing in most cases. Riverside’s appreciation means equity builds quickly for refinancing. |
Riverside Financing Reality: Riverside is the most DSCR-friendly major Southern California city. Its superior rent-to-price ratios mean that multi-family properties and higher-yield SFH can actually qualify for DSCR loans at 1.0x or above, unlike coastal California where DSCR qualification is essentially impossible. Investors from LA and OC who have been locked out of DSCR products in their home markets find Riverside to be one of the first Southern California markets where this financing approach becomes viable. The conforming loan limit covers the vast majority of Riverside purchases, avoiding the jumbo products that increase rates for most coastal CA investors. Combined, these financing advantages mean that investors building their first Southern California real estate portfolio will find Riverside to be both more accessible and more cash-flow-manageable than any comparable coastal market.
8. Frequently Asked Questions
Knowledge Quiz: Riverside Real Estate Investment
Open Quiz
5 quick questions on what you just learned about Riverside investing
1) What metric does the guide use to explain why Riverside cash flow outperforms coastal California, and what are the approximate values?
Answer: B
The Gross Rent Multiplier (GRM) is the ratio of property price to annual rental income. Riverside’s GRM of 16-19x means a $560,000 property generates $28,000-$35,000 in annual rent. Coastal CA markets at 22-28x GRM generate only $20,000-$25,000 annually on a comparable-priced property. This compression is what makes the difference between deeply negative and near-neutral cash flow under the same financing conditions, and explains why BRRRR, DSCR qualification, and positive cash flow are achievable in Riverside but essentially impossible in coastal California.
2) What is the UCR student housing shortage and why does it create investment opportunity?
Answer: C
UCR’s on-campus housing capacity of approximately 5,000-6,000 beds serves only 20-24% of its 25,000+ student population. The remaining 19,000-20,000 students who need housing create a massive and structurally persistent demand for off-campus rentals. This housing deficit has existed for decades and grows with each enrollment expansion. Properties within 1.5 miles of UCR consistently achieve near-100% occupancy through the academic year because supply simply cannot keep pace with demand growth.
3) Why does the BRRRR strategy work in Riverside when it fails to execute in most coastal California markets?
Answer: A
In coastal California, cap rates of 3-4% combined with 6.5-7% mortgage rates mean NOI cannot approach debt service at any refinance scenario, producing deeply negative post-BRRRR cash flow that compounds negatively with each cycle. In Riverside, cap rates of 5-7% in value-add corridors allow post-renovation NOI to approach 1.0x+ DSCR after a 75% LTV refinance. This near-neutral position combined with recovered equity allows investors to cycle capital into the next acquisition, which is mathematically impossible in coastal markets.
4) What specific advantage does Riverside’s regulatory environment offer compared to Los Angeles?
Answer: D
Los Angeles has its own Rent Stabilization Ordinance (RSO) that applies additional restrictions on top of AB 1482, including CPI-only increases (often 3-4%), just cause requirements from early in the tenancy for RSO-covered units, and annual RSO registration fees. Riverside has none of these local additions, operating exclusively under AB 1482 which allows 5% + CPI (max 10%). This means Riverside landlords can increase rents significantly faster in periods of high inflation and have meaningfully simpler compliance requirements. The guide highlights Riverside as the most investor-friendly regulatory environment of any major Southern California city.
5) What is the Metrolink premium and how should Riverside investors use it in their acquisition decisions?
Answer: B
Metrolink commuter rail connects Riverside to downtown Los Angeles in 75-90 minutes. Properties within 0.5-2 miles of Riverside’s Metrolink stations (Downtown Riverside, La Sierra, Hunter Park/UC) attract LA commuter tenants who earn LA wages but prefer to live in Riverside for affordability. These tenants pay 5-10% above-market premiums for convenient rail access. The guide notes this transit premium is not yet fully priced into all Riverside sub-markets, creating an opportunity for investors who evaluate walking distance to Metrolink as part of their acquisition analysis.
Work With a Local Expert in Riverside
We are building a verified network of real estate professionals across every market we cover.

About Our Expert Network
We are finalizing partnerships with verified real estate professionals across every market featured on Builds and Buys. Each expert in our network is selected for their hands-on investment experience, local market knowledge, and commitment to helping buyers and investors make sound decisions.
Our local specialists offer:
- Proven Riverside investment experience including UCR market, BRRRR, and value-add strategies
- La Sierra and Eastside corridor value-add identification and pricing expertise
- UCR off-campus housing office relationships for academic rental placements
- Inland Empire contractor network for renovation projects
- DSCR lender relationships for Riverside’s qualifying properties
- Full transaction support from acquisition through stabilization
Services Covered
- Property sourcing and acquisition
- BRRRR and value-add underwriting
- Academic rental market analysis
- Buyer representation
- Renovation contractor referrals
- ADU feasibility analysis
- Legal and title referrals
- DSCR and conventional financing connections
- UCR-experienced PM referrals
- Insurance and inspection referrals
- 1031 exchange coordination
- Portfolio scaling strategy
Get Connected or Join Our Network
Looking for a local expert to help with your Riverside investment? Reach out and we will connect you with the right professional.
Are you a real estate professional with Riverside investment experience? We are always expanding our network of verified local experts.
Contact us at support@buildsandbuys.com
Find Specialized Inland Empire Real Estate Professionals
Ready to Invest in Riverside?
Riverside is where Southern California’s cash flow story lives. It is the market that LA and OC investors rediscover every time they do the math and realize that the coastal negative carry is not a necessary cost of California investing but a choice that can be avoided by going 60 miles inland. UC Riverside’s permanent housing shortage, the Inland Empire’s 200,000-job logistics economy, the absence of local rent control, and the BRRRR math that actually works all point to the same conclusion: Riverside is one of the most compelling yield and total-return markets available in all of California. Investors who build disciplined portfolios here while their coastal-focused peers are burning cash flow are building the compounding wealth engines that will define their financial position a decade from now.
Continue Your Research
California State Guide
See how Riverside compares to Los Angeles, San Diego, San Francisco, and other California markets.
Step-by-Step Invest
Complete framework for building a real estate investment strategy from scratch.
144-Lesson Course
University-level real estate education covering financing, law, strategy, and management.
For further guidance, explore our State-by-State Investor guides, browse our expert articles, or follow our Step-by-Step Investment Guide.


