Cedar Park Real Estate Investment Guide For 2026
A comprehensive resource for investors looking to capitalize on Austin’s northwestern tech and semiconductor employment corridor in 2026
Quick answers: Top 5 most searched Cedar Park investment questions ▼
Migration data: Where people are moving from to Cedar Park ▼
In This Guide
Click on any section to navigate directly to that content
1. Cedar Park Market Overview
Market Fundamentals
Cedar Park has grown from a modest Austin bedroom community into one of the northwest Austin metro’s most consistently strong suburbs, benefiting directly from its proximity to a genuinely substantial technology and semiconductor employment corridor, most notably Apple’s large northwest Austin campus alongside numerous other technology and healthcare employers spread throughout the broader area. This positioning gives Cedar Park a professional, well-employed tenant base without the single-employer concentration risk seen in more company-town style suburbs.
Key economic indicators that define Cedar Park’s investment case:
- Population: Roughly 82,000 city proper, part of the broader Austin metro’s northwestern growth corridor
- Major Employers: Proximity to Apple’s northwest Austin campus and the broader tech corridor, Cedar Park Regional Medical Center, Cedar Park ISD, a growing retail and entertainment sector anchored by the H-E-B Center
- Median Household Income: Roughly $105,000, among the highest of any Austin metro suburb
- Tech Corridor Proximity: Genuine access to the northwest Austin technology and semiconductor employment corridor without dependence on any single company headquartered in Cedar Park itself
- No State Income Tax: A meaningful benefit for the city’s high-income professional workforce
- Rental Vacancy Rate: Generally under 5 percent citywide
Cedar Park’s economy benefits from genuine diversification within the broader northwest Austin tech corridor: substantial semiconductor and technology employment, Cedar Park Regional Medical Center’s healthcare sector presence, and a growing entertainment and retail sector anchored by the H-E-B Center, home to the Texas Stars minor league hockey team and a regional concert and events venue.
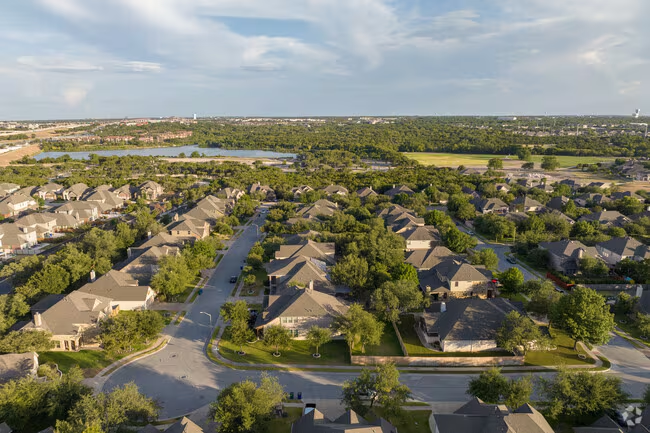
Cedar Park’s proximity to the northwest Austin tech and semiconductor corridor anchors one of the metro’s most consistently strong suburban markets
2026 Economic Outlook
- Continued stability in the broader northwest Austin tech and semiconductor employment corridor
- Ongoing Cedar Park Regional Medical Center expansion
- Twin Creeks and Vista Ridge continuing to absorb new construction demand
- H-E-B Center continuing to anchor regional entertainment and events business
- Continued strong Cedar Park ISD enrollment supporting family relocation demand
Investment Climate
Cedar Park’s investment environment closely resembles other premium northwest Austin metro suburbs, rewarding a balanced, appreciation-leaning approach. Successful Cedar Park investors tend to share a few characteristics:
- Tech corridor commute awareness since properties with reasonable access to the northwest Austin employment corridor consistently command the strongest rent premium
- Comfort with a high-income, well-employed tenant base reflecting the city’s strong median household income and concentration of technology and healthcare professionals
- School district understanding, since both Cedar Park ISD and portions served by Leander ISD carry strong reputations that genuinely drive family relocation
- Balanced return expectations, targeting solid appreciation alongside moderate cap rates rather than either extreme
- Appreciation for Texas’s landlord friendly legal environment, which removes much of the regulatory friction seen in coastal tech markets
Cedar Park’s investment case closely parallels Round Rock’s: genuine tech corridor exposure at a meaningful discount to Austin’s urban core, without the single-employer concentration risk of a true company town, since the broader northwest tech corridor spreads employment across numerous companies rather than any single dominant employer within Cedar Park itself.
Historical Performance
| Period | Market Driver | Avg Annual Appreciation | Key Event |
|---|---|---|---|
| 2010-2014 | Steady suburban growth, early tech corridor expansion | 4-5% | H-E-B Center opens, anchoring regional entertainment growth |
| 2015-2019 | Accelerating northwest Austin tech corridor growth | 6-8% | Continued Apple campus expansion drives broader corridor employment growth |
| 2020-2022 | Pandemic era migration, Austin metro wide price surge | 12-16% | Households priced out of northwest Austin discover Cedar Park value |
| 2023-2024 | Rate normalization, continued tech sector strength | 5-7% | Twin Creeks and Vista Ridge continue absorbing new construction demand |
| 2025-2026 | Continued Austin metro affordability search, stable tech employment | 6-7% (projected) | Limited remaining vacant land supports continued price growth toward the Leander border |
Cedar Park’s appreciation profile has run consistently strong, closely tracking the broader northwest Austin tech corridor’s employment growth. A $440,000 Cedar Park property purchased today benefits from genuine, diversified tech-sector demand while sitting meaningfully below comparable northwest Austin properties.
Demographic Trends Driving Demand
- Northwest Austin Tech Corridor Proximity – Genuine access to Apple’s campus and the broader semiconductor and technology employment corridor without single-employer dependence
- Central and Northwest Austin Affordability Arbitrage – Tech workers and families priced out of Austin’s core relocating for meaningfully better value
- Strong Cedar Park and Leander ISD Schools – A genuine and quantifiable driver of family relocation, particularly among tech sector employees with children
- Cedar Park Regional Medical Center – Growing regional healthcare employment supporting continued professional relocation demand
- H-E-B Center Entertainment District – Regional concert, sports, and events venue supporting continued hospitality and retail employment
- International Tech Workforce – A meaningful population tied to the broader tech corridor’s global workforce, supporting strong rental demand
📚 New to real estate investing? Master the fundamentals with our professional course Learn more →
2. Neighborhood Hotspots
Cedar Park Investment Neighborhood Map
Interactive map of Cedar Park’s investment neighborhoods. Green stars show top hotspots, blue circles mark established markets, and orange circles highlight emerging areas.
Core Investment Neighborhoods
Detailed Submarket Analysis: All Cedar Park Neighborhoods
| Neighborhood | Price Range (SFH) | Cap Rate | Growth Drivers | Best Strategy |
|---|---|---|---|---|
| Twin Creeks | $425K-$625K | 4.5-5.5% | Newer construction, tech corridor proximity | Appreciation focused hold |
| Buttercup Creek | $375K-$550K | 4.5-5.5% | Established community, consistent demand | Long term hold |
| Vista Ridge | $390K-$570K | 4.5-5.5% | Retail corridor proximity, tech worker demand | Balanced buy and hold |
| Ranch at Brushy Creek | $400K-$575K | 4.0-5.0% | Established community, strong schools | Long term hold |
| Cypress Creek / South Cedar Park | $325K-$460K | 5.0-6.0% | Lowest entry point, established central location | Value-focused buy and hold |
| Anderson Mill (Cedar Park portion) | $310K-$440K | 5.5-6.5% | Established central location, steady demand | Balanced buy and hold |
| Whitestone | $340K-$490K | 4.5-5.5% | Established family neighborhood, school proximity | Long term hold |
| Gann Ranch | $360K-$510K | 4.5-5.5% | Established area, family demand | Balanced buy and hold |
| Northwest Cedar Park / Leander Border | $390K-$560K | 4.5-5.5% | Emerging growth corridor, newer construction | Appreciation focused hold |
Expert Insight: “Cedar Park tenants skew heavily toward dual-income tech professional households, and that shows up in how they treat a property. We see genuinely low turnover and strong on-time payment rates across nearly every neighborhood in the city. The bigger question for investors isn’t tenant quality, it’s whether you’re comfortable with Cedar Park’s moderate cap rate in exchange for that reliability and the metro’s continued appreciation trajectory.” – Alicia Prentiss, Broker, Northwest Austin Investment Group
3. Property Types
| Investment Goal | Best Property Type | Best Neighborhoods | Minimum Capital |
|---|---|---|---|
| Maximum Appreciation | New construction SFH | Twin Creeks | $106,250+ |
| Best Cash Flow in Cedar Park | Value-priced SFH | Cypress Creek / South Cedar Park | $81,250+ |
| Most Dependable Occupancy | SFH near tech corridor | Buttercup Creek, Ranch at Brushy Creek | $93,750+ |
| Lowest Management | Newer construction SFH | Twin Creeks, Vista Ridge | $97,500+ |
Don’t guess the costs. Our Complete Renovation & Remodeling Cost Guide covers 400+ pages of project by project breakdowns with real contractor pricing ranges.
4. Cost Analysis
Acquisition Cost Breakdown (Cedar Park)
| Expense Item | Typical Cost | Example ($440,000 Property) | Notes |
|---|---|---|---|
| Down Payment | 20-25% (investment) | $88,000-$110,000 | Standard for conventional investment financing |
| Closing Costs | 2-3% of price | $8,800-$13,200 | Title, escrow, lender fees, recording |
| General Inspection | $425-$625 | $500 | Foundation and HVAC condition especially important for pre-1995 Anderson Mill and Cypress Creek stock |
| Foundation Inspection | $350-$550 | $425 | Recommended for older homes given regional Central Texas clay soil movement |
| Roof Inspection | $150-$300 | $225 | Hail is a recurring Central Texas risk; verify insurance claim history |
| Initial Repairs | 2-8% of price | $8,800-$35,200 | Highly variable depending on neighborhood and age of housing stock |
| Reserves (6 months) | 6 months expenses | $11,500-$16,000 | Emergency fund for vacancy and repairs |
| TOTAL MINIMUM ENTRY | ~26-40% of value | $117,875-$175,650 | Meaningfully lower than a comparable northwest Austin urban core purchase |
Sample Cash Flow Analysis: Buttercup Creek Single-Family Rental
| Item | Monthly | Annual | Notes |
|---|---|---|---|
| Gross Rent | $2,350 | $28,200 | 3BR, Buttercup Creek, well maintained, tech corridor adjacent |
| Less Vacancy (4%) | -$94 | -$1,128 | Conservative estimate given the dependable tech-worker tenant demand |
| Property Taxes | -$730 | -$8,760 | ~2.0% effective rate typical for Williamson County |
| Insurance | -$160 | -$1,920 | Landlord policy including hail and wind coverage |
| Property Management (8%) | -$188 | -$2,256 | Standard rate for out of state investors in the Austin metro |
| Maintenance + CapEx | -$165 | -$1,980 | 7% of rent for a well maintained property |
| Net Operating Income | $1,013 | $12,156 | Before mortgage |
| Mortgage ($460,000 total cost, 25% down, 6.75%, 30yr) | -$2,239 | -$26,868 | Principal and interest only |
| CASH FLOW | -$1,226 | -$14,712 | Negative at 75% leverage; a larger down payment or accepting a moderate carry is typical for this submarket |
| Cap Rate | 2.64% | NOI / Total Cost on this specific example; well-selected Buttercup Creek properties can reach 4.5-5.5% | |
| Total Return (6% appreciation) | ~15% | Including appreciation and principal paydown |
This example illustrates why many Cedar Park investors accept modest negative cash flow at 75% leverage: the city’s strong appreciation trajectory, driven by continued northwest Austin tech corridor employment growth, has historically delivered total returns well above the negative carry, particularly for investors with a 30 to 35 percent down payment structure that brings the property closer to breakeven from day one.
Expert Insight: “Cedar Park math looks a lot like Round Rock math, and that’s not a coincidence, both cities occupy a similar position relative to their respective Austin employment anchors. Where Cedar Park differs is that its tech corridor draws from a broader set of employers spread across the northwest Austin area rather than one dominant company, which I think of as a genuine, if modest, diversification benefit worth factoring into the underwriting even though it won’t show up as a number on a spreadsheet.” – Jonathan Ashworth, CPA, Austin Metro Real Estate Tax Group
5. Legal Framework
⚠️ Cedar Park Compliance Notice
Texas is one of the most landlord friendly states in the country, and Cedar Park has not layered any additional city level tenant protection ordinances on top of state law. This guide provides an overview only. Always consult a Texas licensed real estate attorney before acquiring rental properties, and confirm current statute language before relying on any specific notice period or deposit rule.
Texas and Cedar Park-Specific Regulations
Cedar Park landlords operate under Texas Property Code with no additional municipal overlay:
- No Rent Control: Texas state law preempts any city, including Cedar Park, from enacting rent control ordinances of any kind.
- No Just Cause Eviction Requirement: Landlords may decline to renew a lease at term expiration for any lawful reason without needing to state cause.
- Three Day Notice to Vacate: The Texas default notice period for non-payment is three days unless the lease specifies otherwise.
- Security Deposits: No statutory cap on deposit amount. Landlords must return deposits, or provide an itemized list of deductions, within 30 days of move-out.
- Habitability (Repair and Deduct): Tenants may pursue repair and deduct remedies for conditions materially affecting health and safety if the landlord fails to repair after proper written notice.
- No Source of Income Protection Statewide: Texas does not require landlords to accept Section 8 vouchers.
- HOA Rules for Master-Planned Communities: Properties in Twin Creeks and other master-planned developments are subject to HOA rules that may restrict rental use, leasing terms, or property modifications; always review HOA covenants before purchase.
Compliance Best Practices
While Cedar Park’s regulatory burden is light compared to markets like Seattle, disciplined operators still follow sound practices:
- Written Lease Agreements: Always use a written lease with clear rent amount, due date, late fee terms, and maintenance responsibilities spelled out.
- HOA Compliance Review: For properties in Twin Creeks, Ranch at Brushy Creek, or other master-planned communities, confirm current HOA rental restrictions before purchase.
- Move-In Documentation: Photograph or video the property condition at move-in to protect against disputed deposit deductions later.
- Timely Deposit Return: Return deposits or itemized deduction lists within the 30 day statutory window to avoid potential bad faith damages claims.
- Property Tax Protest: Williamson County appraisal values can be protested annually; many Cedar Park investors successfully manage their assessed value through this process, particularly important given the county’s continued strong appreciation.
- Local Property Management: A locally based manager with specific tech worker and corporate relocation tenant experience is strongly recommended for out of state investors.
Useful Cedar Park Resources
- Williamson Central Appraisal District: wcad.org
- Texas Apartment Association / Texas Property Code reference: texasapartmentassociation.org
- City of Cedar Park Development Services: cedarparktexas.gov
- Williamson County Justice of the Peace Courts (eviction filings route through these courts): wilco.org
| Regulation | Cedar Park / Texas Requirement | Comparison (Seattle, WA) | Investor Impact |
|---|---|---|---|
| Eviction | No just cause required; 3-day notice standard | Just cause required always | Significantly easier and faster to remove non-paying or problem tenants |
| Rent Control | Prohibited statewide by Texas law | 180 day notice for CPI-exceeding increases | Landlords may adjust rent at lease renewal without restriction |
| Screening | Landlord discretion within fair housing law | First-in-time rule | Landlords may select their preferred qualified applicant |
| Security Deposits | No cap; 30 day return requirement | Total move-in fees limited | Landlords can require larger deposits for higher risk tenants |
| Rental Registration | Not required | RRIO required (rolling cycle) | No administrative registration burden or inspection cycle |
6. Step-by-Step Cedar Park Investment Playbook
Define Your Cedar Park Strategy
Cedar Park rewards a balanced approach that leans toward appreciation, similar to the broader Austin metro but with genuinely diversified tech corridor exposure. Before buying, be clear on which of these strategies you are executing:
Appreciation-Weighted Growth Play
Buy in Twin Creeks, targeting Cedar Park’s strongest new construction and clearest appreciation trajectory tied to continued tech corridor growth.
Established Dependability Play
Buy in Buttercup Creek or Ranch at Brushy Creek, targeting the city’s most reliable, tech-worker-anchored tenant demand.
Retail Corridor Play
Buy near Vista Ridge, capturing appeal to professionals valuing retail and entertainment proximity alongside tech corridor access.
Value-Add / BRRRR
Target dated Anderson Mill or Cypress Creek properties, renovate to increase rent and value, then refinance to redeploy capital, benefiting from Cedar Park’s continued overall appreciation trajectory.
Build Your Cedar Park Team
Cedar Park’s tech-adjacent economy and master-planned community structure make certain team relationships especially valuable:
- Williamson County Specialist Real Estate Agent: Should understand tech corridor commute value and the pricing gradient between Cedar Park and northwest Austin proper.
- Property Manager with Corporate Relocation Experience: Especially valuable given the concentration of tech and healthcare sector corporate transfers in the local tenant pool.
- HOA-Experienced Contractor and Property Manager: For properties in Twin Creeks or other master-planned communities, familiarity with HOA modification approval processes speeds up renovation and turnover timelines.
- Real Estate CPA familiar with Williamson County protest procedures: For annual appraisal protests and depreciation strategy given the county’s continued strong appreciation.
- Insurance Agent Specializing in Central Texas Wind and Hail Coverage: Given regional storm frequency, proper coverage structuring is worth the extra diligence.
Expert Tip: When interviewing a property manager, ask specifically about their experience with tech and healthcare sector corporate relocation tenants, since Cedar Park’s tech corridor proximity creates genuine opportunity in the furnished mid-term niche that a manager unfamiliar with the local employment base may not know how to serve effectively.
Cedar Park-Specific Due Diligence
Standard due diligence items plus these Cedar Park-critical checks:
Physical Due Diligence
- Foundation inspection given regional clay soil movement, especially for older Anderson Mill and Cypress Creek stock
- Roof condition and prior hail damage claim history
- HVAC system condition given Central Texas summer heat demands
- Verify actual commute time to the northwest Austin tech corridor during peak hours
- HOA documentation review for Twin Creeks or other master-planned properties
- Water heater and plumbing age in older established housing stock
Financial and Regulatory Due Diligence
- Verify current Williamson County appraised value versus purchase price
- Confirm HOA rental restrictions for any master-planned community property
- Pull permit history for any additions or renovations
- Review current lease terms and rent roll if purchasing an occupied property
- Verify insurance quotes before closing given regional hail exposure
- Research Cedar Park and Leander ISD school ratings when evaluating rent comps for family-oriented properties
Competing and Acquiring in Cedar Park
Cedar Park remains competitive given continued Austin metro migration, but strategies exist for prepared investors:
- Target the northwest Austin affordability gap directly: Investors who buy in Cedar Park while comparable northwest Austin properties continue commanding a premium are positioned to capture ongoing convergence as more buyers seek value.
- Pre-inspections in competitive submarkets: In desirable areas like Twin Creeks, conducting inspections before submitting an offer can allow for cleaner, more competitive bids.
- Builder relationships in growth corridors: Building direct relationships with local builders in Twin Creeks or the Leander border can provide access to investor pricing on new construction inventory.
- Off-market sourcing in Anderson Mill: Direct mail and relationship-based sourcing can uncover off-market deals among long-term owners in the city’s more established, affordable neighborhoods.
- Corporate relocation network relationships: Building relationships with local corporate relocation service providers can create a pipeline of qualified tenant leads from the broader tech corridor.
Property Management in Cedar Park
Cedar Park’s high-income, well-employed tenant base makes management relatively straightforward compared to higher-turnover or heavily regulated markets. Key management focuses:
Tenant Screening Protocol
Without Texas-mandated first-in-time or source of income requirements, landlords have flexibility, but disciplined screening still matters:
- Verify income at 2.5 to 3 times monthly rent as a standard baseline
- Run credit and criminal background checks consistently across all applicants
- Contact prior landlords directly rather than relying solely on written references
- For corporate relocation tenants, verify employment and relocation package details directly with the employer where possible
- Document all decisions to protect against disputes down the line
Typical Cedar Park Management Fees
- Single-family management: 8-10% of monthly rent
- Multi-family management: 7-9% of monthly rent
- Leasing fee: 50-100% of one month’s rent
- Lease renewal fee: $100-$250 per renewal
- Furnished corporate housing management: Often structured with a premium fee reflecting added complexity of furnishings and shorter-term leasing
7. Financing Options for Cedar Park
| Loan Type | Down Payment | Rate Premium | Best For | Cedar Park Note |
|---|---|---|---|---|
| Conventional Investment | 20-25% | +0.5-0.75% | Strong W-2 income, good credit | Most Cedar Park properties fall well under conforming loan limits |
| DSCR Loan | 25-30% | +1-1.75% | Investors who want no income verification | Note: Cedar Park’s cap rates often fall below 1.0x DSCR coverage at current interest rates on many properties, similar to the challenge seen in other premium Austin metro suburbs; a larger down payment is typically necessary to qualify |
| Portfolio Loan | 20-25% | +0.75-1.5% | Multiple properties, self-employed | Regional Central Texas banks are generally receptive to relationship-based portfolio lending |
| House Hacking (FHA) | 3.5% | Standard + MIP | Owner-occupying one unit of 2-4 unit property | A solid entry point for tech corridor workers wanting to house hack near their employer |
| Jumbo Investment | 25-30% | +0.75-1.25% | Higher-end Twin Creeks purchases | Relevant for the highest priced Cedar Park properties approaching or exceeding conforming loan limits |
| Hard Money (Bridge) | 15-25% | 9-12% rate | BRRRR acquisitions in Anderson Mill or Cypress Creek | Several Austin metro-focused hard money lenders are active throughout Williamson County |
Cedar Park Financing Reality: Similar to Round Rock and Georgetown, many Cedar Park investment properties do not comfortably clear DSCR loan coverage requirements at standard leverage given current interest rates and the city’s moderate cap rates. Investors should expect to rely more heavily on conventional financing with full income documentation, or plan for a 30 to 35 percent down payment structure to bring a Cedar Park property to comfortable DSCR coverage or near-breakeven conventional cash flow.
8. Frequently Asked Questions

Knowledge Quiz: Cedar Park Real Estate Investment
Open Quiz
5 quick questions on what you just learned about Cedar Park investing
1) What large technology company does the guide identify as having a substantial campus presence near Cedar Park?
Answer: C
The guide notes Cedar Park’s proximity to Apple’s substantial northwest Austin campus as a key part of the broader tech and semiconductor employment corridor benefiting the city.
2) According to the guide, how does Cedar Park’s employer concentration differ from a true company town?
Answer: D
The guide explains that Cedar Park benefits from a broad, diversified northwest Austin technology employment corridor rather than depending on a single dominant employer headquartered within the city, a meaningfully different risk profile than a true company town.
3) Which neighborhood does the guide identify as Cedar Park’s clearest appreciation play with the strongest new construction?
Answer: A
Twin Creeks is identified as Cedar Park’s newer master-planned community offering strong appreciation potential and continued new construction, consistently the city’s clearest appreciation play.
4) According to the guide’s expert insight, how does Cedar Park’s diversification compare to Round Rock’s?
Answer: B
The guide’s expert insight explains that Cedar Park’s tech corridor draws from a broader set of employers spread across the northwest Austin area rather than one dominant company, a genuine, if modest, diversification benefit worth factoring into the underwriting.
5) What does the guide say about DSCR loan qualification for Cedar Park investment properties?
Answer: C
The guide notes that Cedar Park’s cap rates often fall below 1.0x DSCR coverage at current interest rates and standard leverage, similar to the challenge seen in other premium Austin metro suburbs like Round Rock and Georgetown, meaning investors typically need a larger down payment or full income documentation.
Work With a Local Expert in Cedar Park
We are building a verified network of real estate professionals across every market we cover.

About Our Expert Network
We are finalizing partnerships with verified real estate professionals across every market featured on Builds and Buys. Each expert in our network is selected for their hands-on investment experience, local market knowledge, and commitment to helping buyers and investors make sound decisions.
Our local specialists offer:
- Proven experience with investment and income-producing properties
- Deep knowledge of local pricing, rental yields, and neighborhood dynamics
- Guidance on financing, legal structure, and due diligence
- Access to off-market and pre-market opportunities
- Full transaction support from search through closing
- Ongoing portfolio and property management referrals
Services Covered
- Property sourcing and acquisition
- Investment analysis and underwriting
- Buyer representation
- Market comparables and valuations
- Short-term and long-term rental strategy
- Value-add and renovation guidance
- Legal and title referrals
- Financing and lender connections
- Property management referrals
- Insurance and inspection referrals
- 1031 exchange coordination
- Exit strategy planning
Get Connected or Join Our Network
Looking for a local expert to help with your investment? Reach out and we will connect you with the right professional for your market and strategy.
Are you a real estate professional with a track record working with investors? We are always expanding our network of verified local experts.
Contact us at support@buildsandbuys.com
Find Specialized Cedar Park Real Estate Professionals
Ready to Invest in Cedar Park?
Cedar Park offers one of the Austin metro’s most dependable technology-adjacent investment profiles, benefiting from genuine proximity to a diversified northwest Austin tech and semiconductor employment corridor, including Apple’s substantial campus presence, without the concentration risk of a true company town. For investors who understand Cedar Park’s total-return character, accept moderate cap rates in exchange for strong, dependable tech-driven appreciation, and build the right local team to navigate master-planned community HOA structures, Cedar Park delivers a genuinely diversified entry point into the Austin metro’s technology corridor, all within Texas’s landlord friendly legal framework.
Continue Your Research
Austin Metro Guide
See how Cedar Park compares to central Austin and other metro submarkets.
Round Rock Guide
Compare Cedar Park’s diversified tech corridor to Round Rock’s Dell-anchored economy.
144-Lesson Course
University-level real estate education covering financing, law, strategy, and management.
For further guidance, explore our State-by-State Investor guides, browse our expert articles, or follow our Step-by-Step Investment Guide.