Boulder Colorado Real Estate Investment Guide For 2026
The complete investor’s guide to Colorado’s most supply-constrained city, where geography-enforced scarcity, University of Colorado demand, and one of the highest concentrations of tech and research employment per capita in the nation create a long-term appreciation case that stands alone in the Mountain West
Quick answers: Top 5 most searched Boulder investment questions ▼
Migration data: Where people are moving from to Boulder ▼
In This Guide
Click on any section to navigate directly to that content
1. Boulder Market Overview
Market Fundamentals
Boulder is Colorado’s most unusual real estate investment market and one of the most distinctive in the United States. It operates by different rules than every other Colorado city because its supply constraints are not policy preferences or temporary conditions. They are permanent geographic facts reinforced by 50 years of deliberate land protection.
The Flatirons and Rocky Mountain National Park create an impenetrable wall to the west and northwest. The Boulder Blue Line policy prohibits development above 5,750 feet elevation on the mountain backdrop. The city’s Open Space and Mountain Parks program has permanently protected 45,000+ acres surrounding the city. And Boulder’s growth management policies, among the most restrictive in any American city, limit the pace of new construction even on eligible land.
- Population: 108,000 city, 330,000+ Boulder County
- Major Employers: Google (2,000+ engineers), IBM Research, Twitter/X, Oracle, Zayo, NCAR, NOAA, NIST, University of Colorado Boulder (36,000 students, 7,000+ employees)
- Median Household Income: $80,000+ city; north Boulder tech corridor exceeds $110,000
- Education: 70%+ college graduates, highest rate of any Colorado city
- Vacancy Rate: Under 3.5% citywide, under 2% near CU campus and North Boulder
- Open Space Protected: 45,000+ acres, more open space per capita than any major U.S. city
The result of this permanent supply constraint is a market that behaves more like Manhattan or San Francisco than a typical Colorado city. When demand increases, prices rise because supply cannot respond. When demand softens, the supply constraint prevents the catastrophic price declines that afflict other markets. Boulder real estate simply cannot be oversupplied.
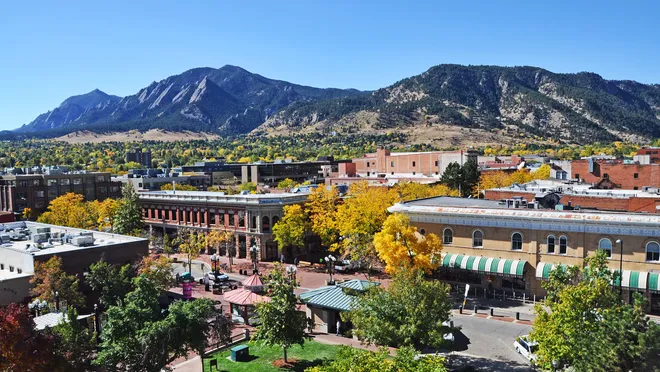
The Flatirons create Boulder’s iconic backdrop while simultaneously enforcing the geographic supply constraint that makes Boulder real estate one of the most durable long-term investments in the Mountain West
2026 Economic Outlook
- Google Boulder expanding engineering headcount by 300+ positions in AI and cloud infrastructure
- CU Boulder receiving $180M+ in federal research grants for climate, aerospace, and quantum computing
- NCAR and NOAA expanding research programs with 200+ new scientist positions
- Boulder’s venture capital ecosystem funding 50+ tech startups annually, creating pre-IPO renter demand
- National Outdoor Recreation sector headquarters consolidating in Boulder (REI, Backcountry, Evo)
Understanding Boulder’s Investment Thesis: Pure Appreciation
⚠️ Critical Expectation Setting
Boulder is not a cash flow market. At a $975,000 median price with typical cap rates of 3 to 4%, negative cash flow of $2,000 to $4,000/month is the norm with conventional financing. Investors who evaluate Boulder using cash flow metrics will never buy and will miss one of the most consistent long-term appreciation markets in the American West. The correct frame for Boulder is total return: equity compounding through appreciation plus principal paydown. An investor who accepted $2,500/month negative carry on a Boulder property purchased for $600,000 in 2014 and sold in 2024 for $1,050,000 generated over $400,000 in equity gain against approximately $300,000 in total carrying costs. The math works decisively in favor of the long-term holder.
Geographic Constraint
The Flatirons, Rocky Mountain National Park, Blue Line, and 45,000 acres of Open Space make Boulder physically unable to expand. This is not a policy that can be reversed. The mountains do not negotiate. Every year of population growth with no new land creates permanent structural appreciation pressure.
Tech and Research Salary Premium
Google engineers, CU faculty, NCAR researchers, and startup founders earn $120,000 to $350,000+. These incomes support rents and purchase prices that are impossible to sustain in markets without comparable employer density. Boulder’s salary base is 40 to 60% above Colorado median, creating a permanent premium rental market.
University Demand Floor
CU Boulder’s 36,000 students create a baseline demand that does not fluctuate with economic cycles. The university’s national research reputation attracts increasingly affluent students with higher income parents, supporting above-average student housing rents. CU’s Hill neighborhood maintains vacancy under 2% regardless of broader market conditions.
Lifestyle and Status Premium
Boulder commands a premium beyond what its employment alone would justify. The Flatirons trail access, Pearl Street culture, outdoor recreation community, and Boulder’s status as a global lifestyle brand attract wealthy individuals who choose to rent rather than buy, maintaining demand for premium properties from a tenant pool that does not exist in other Colorado cities.
Historical Performance
| Period | Market Driver | Avg Annual Appreciation | Key Event |
|---|---|---|---|
| 2008-2010 | Financial crisis, recession | -2% to +2% | Boulder declined less than national average and recovered faster; supply constraint buffer demonstrated |
| 2011-2015 | Tech sector growth, Google expansion | 7-11% | Google Boulder campus established; national tech boom drives high-income migration |
| 2016-2019 | Continued tech growth, startup ecosystem | 9-13% | Boulder ranked top 5 nationally for startup density; premium rents establish new floors |
| 2020-2022 | Remote work premium, COVID migration | 15-22% | Boulder’s lifestyle premium reaches widest recognition; inventory hits historic lows |
| 2023-2024 | Rate normalization, market correction | 2-6% | Market softened but supply constraint prevented meaningful price decline; rental market unchanged |
| 2025-2026 | Tech hiring recovery, CU research expansion | 8-12% (projected) | Google AI expansion and CU federal research grants drive renewed demand |
Boulder’s 20-year average annual appreciation exceeds 11%, among the highest of any U.S. city outside of San Francisco and Seattle. A $500,000 Boulder property purchased in 2005 would be worth approximately $1,700,000 to $1,900,000 today. This compounding effect, even with significant negative carry, represents extraordinary wealth creation for patient investors.
📚 New to real estate investing? Master the fundamentals with our professional course Learn more →
2. Neighborhood Hotspots
Boulder Investment Neighborhood Map
Interactive map of Boulder’s investment neighborhoods. Green stars mark top hotspots, blue circles show established markets, and orange circles highlight emerging areas including the Boulder County suburbs offering better value plays.
Core Investment Neighborhoods
Boulder vs Boulder County: The Value Play Alternative
For investors who want Boulder County’s long-term appreciation story at more accessible price points, three adjacent communities offer compelling alternatives:
| Market | Median Price | Discount to Boulder | Cap Rate | Best For |
|---|---|---|---|---|
| Boulder (City) | $975,000 | Benchmark | 3.0-4.0% | Maximum appreciation, long-term equity compounding |
| Louisville | $680,000 | 30% discount | 4.0-5.5% | Boulder County appreciation with manageable entry |
| Superior | $700,000 | 28% discount | 4.2-5.5% | New construction, family market, post-Marshall Fire opportunity |
| Longmont | $480,000 | 51% discount | 5.0-6.5% | Cash flow and affordability, best yields in Boulder County |
Expert Insight: “The question I get most often from out-of-state investors is whether Boulder is too expensive to make sense. I show them the 20-year returns data every time. $500,000 invested in Boulder in 2004 is worth $1.8 million today. The investor who put down $125,000 and financed the rest paid maybe $250,000 in negative carry over 20 years. Their equity gain is $1.3 million. No other Colorado market comes close to that 5 to 1 return on invested carrying costs. Boulder’s secret is not that it appreciates fast, although it does. The secret is that it cannot depreciate for long because it cannot grow. Every correction is temporary. Every supply constraint is permanent. The asymmetry is breathtaking when you see it clearly.” – Dr. Rachel Morrison, Principal, Boulder Real Estate Capital Group
3. Property Types
| Investment Goal | Best Property Type | Best Areas | Minimum Capital |
|---|---|---|---|
| Maximum Appreciation | SFH in supply-constrained core | Mapleton Hill, North Boulder, South Boulder | $250,000+ |
| Best Boulder Income | Hill student housing or rare multi-family | The Hill, University Hill adjacent | $200,000+ |
| Lower Entry, Boulder County | Louisville SFH or Superior new construction | Louisville, Superior | $145,000+ |
| Cash Flow and Boulder Access | Longmont SFH with tech worker positioning | Longmont | $110,000+ |
Our Complete Renovation and Remodeling Cost Guide covers 400+ pages of project breakdowns with real Boulder County contractor pricing. Note that Boulder contractors command a premium of 15 to 25% above Denver metro rates due to local demand and regulation complexity.
4. Cost Analysis
Acquisition Cost Breakdown (Boulder)
| Expense Item | Typical Cost | Example ($975,000 Property) | Notes |
|---|---|---|---|
| Down Payment | 25-30% | $243,750-$292,500 | Most Boulder purchases require jumbo financing; higher down payment requirements common |
| Closing Costs | 2-3% | $19,500-$29,250 | Title, jumbo lender fees, recording, Boulder County transfer |
| Inspection | $600-$1,000 | $800 | Boulder inspectors charge premium rates; structural and environmental assessments often added |
| Radon Testing | $200-$400 | $300 | Boulder County has elevated radon. Mitigation $1,000 to $3,500 given premium contractors. |
| Hail Assessment | Part of inspection | $0 | Boulder has hail exposure. Class 4 roofing recommended. Insurance hail endorsement essential. |
| Flood Zone Assessment | Part of title | $0 | Boulder Creek flood zone affects some downtown and east Boulder properties. Verify FEMA status. |
| Reserves | 6 months expenses | $25,000-$40,000 | Boulder’s negative carry requires larger reserves than typical Colorado markets |
| TOTAL MINIMUM ENTRY | ~30-35% | $289,350-$362,850 | The highest capital requirement of any Colorado city; not accessible to all investors |
Cash Flow Analysis: Three Boulder Scenarios Side by Side
| Scenario | Property | Gross Rent | NOI | Mortgage | Monthly Cash Flow | 10yr Equity Gain (11% apprec.) |
|---|---|---|---|---|---|---|
| North Boulder SFH | $1.2M, 25% down | $4,800/mo | $3,100/mo | -$5,525/mo | -$2,425/mo | +$1,890,000 in value |
| The Hill 4BR Student | $950K, 25% down | $4,800/mo (per room) | $2,900/mo | -$4,368/mo | -$1,468/mo | +$1,498,000 in value |
| East Boulder Condo | $650K, 25% down | $2,500/mo | $1,600/mo | -$2,989/mo | -$1,389/mo | +$1,025,000 in value |
Note: 10-year equity gain calculation uses 11% annual appreciation compounded from purchase price. Actual results vary. These figures illustrate the investment thesis: the total equity gain in each scenario dramatically exceeds the total carrying cost over the holding period, even with significant monthly negative cash flow. This is the core of Boulder’s total return investment case.
The Boulder Calculus: For the East Boulder condo scenario, the investor pays $1,389/month negative carry, or $166,680 over 10 years. The property generates approximately $1,025,000 in equity gain (assuming 11% annual appreciation). The return on total invested capital including down payment ($162,500) plus carrying costs ($166,680) is approximately 3.1 times on a $329,180 total investment. No other Colorado market comes close to this leverage math over a 10-year horizon, even with negative carry baked in throughout the holding period.
5. Legal Framework
⚠️ Boulder Regulatory Notice
Boulder has some of the most complex rental regulations in Colorado, including occupancy limits, STR primary residence requirements, and actively enforced tenant protections. The city’s political orientation has generated progressive tenant legislation that is meaningfully more protective than Colorado state law. This does not make Boulder uninvestable, but it makes professional property management essentially mandatory and legal consultation critical before any acquisition.
Boulder-Specific Regulations
- Occupancy Limits: Boulder’s Occupancy Standards limit single-family residences to no more than 3 unrelated adults without special licensing. Properties renting to 4+ unrelated CU students require a Group Living License from the City of Boulder. Similar to Fort Collins’ rooming house license but with additional Boulder-specific requirements.
- Group Living License: Required for 4+ unrelated adults in a single-family structure. Application involves inspection, compliance with specific habitability standards, neighbor notification in some cases, and annual renewal. More rigorous than Fort Collins’ equivalent process.
- STR Primary Residence: Boulder requires STR operators to use their primary residence. Investment properties cannot be operated as short-term rentals in most zones. This eliminates Airbnb as a viable strategy for investment properties.
- Just Cause Eviction: As of 2026, Boulder is evaluating implementation of just cause eviction requirements similar to Denver’s ordinance. Investors should confirm current status with a Boulder attorney before acquisition, as this regulation may have been implemented.
- Rent Increase Limitations: Colorado requires 60-day notice. Boulder has periodically discussed additional rent increase restrictions. Confirm current requirements with counsel.
- Rental License: All Boulder rental units must be licensed with the City of Boulder. Licensing involves inspection, compliance with minimum habitability standards, and annual renewal. Boulder enforces this actively.
- Flood Plain: Properties within the Boulder Creek flood plain require flood insurance in addition to standard landlord coverage. Confirm FEMA status before any acquisition near the creek.
Boulder Compliance Best Practices
- Rental License First: Obtain a Boulder rental license before placing any tenant. Boulder enforces unlicensed rentals actively and penalties can be significant.
- Group Living License for Student Housing: If student housing strategy involves 4+ unrelated adults, Group Living License is mandatory. Apply early: Boulder’s processing can take 4 to 8 weeks.
- Professional Boulder Property Manager: Boulder’s regulatory complexity makes professional management essential for out-of-state investors and advisable even for local investors with 3+ units. Select a manager with documented Boulder-specific licensing and tenant law experience.
- Lease Annual Review: Review and update leases annually with a Boulder-licensed attorney. Tenant protection legislation in Boulder evolves more rapidly than in other Colorado jurisdictions.
- Flood Insurance: For any property within or adjacent to the Boulder Creek flood plain, obtain flood insurance regardless of whether a lender requires it. Boulder Creek flooding events occur periodically and were catastrophic in 2013.
Useful Boulder Resources
- Boulder Rental Licensing: bouldercolorado.gov/rentallicense
- Boulder Group Living: bouldercolorado.gov/groupliving
- Boulder District Court (evictions): boulder.courts.state.co.us
- CU Boulder Off-Campus Housing: housing.colorado.edu/off-campus
6. Step-by-Step Boulder Investment Playbook
Decide: Boulder City or Boulder County
Before selecting a property, make the fundamental strategic decision about whether to invest in Boulder city or the surrounding county. This is not a minor question, it determines your capital requirement, regulatory exposure, and return profile.
Boulder City
Maximum appreciation potential with permanent supply constraint. Accept significant negative carry. Requires $250,000+ liquid capital. Subject to full Boulder regulatory complexity. Best for wealthy investors with 10+ year horizon focused exclusively on equity compounding.
Boulder County (Louisville, Superior, Longmont)
Boulder County appreciation at significantly lower entry cost and better cash flow. Standard Colorado state regulations without Boulder’s municipal overlays. Better capital efficiency and more accessible to a wider range of investors. Trade-off is slightly lower appreciation than Boulder city itself.
Build Your Boulder Team
- Boulder-Specialist Investor Agent: Must understand Boulder’s unique market dynamics: supply constraint thesis, CU campus impact zones, Google corridor premium, and Group Living License requirements for student housing. Ask for their specific experience with investment transactions above $800,000.
- Boulder Real Estate Attorney: Non-negotiable. Boulder’s regulatory environment is complex and evolving. A Boulder-specific attorney should review all leases, Group Living License applications, and any HOA documentation before acquisition.
- Boulder-Licensed Property Manager: Must have specific experience with Boulder rental licensing, Group Living permits, and Boulder’s tenant protection landscape. Generic Colorado managers are not equipped for Boulder’s specifics.
- Jumbo Lender: Most Boulder properties require jumbo financing. Work with a lender who specializes in jumbo investment loans and has experience with Boulder’s market. Several regional and national private banks maintain Boulder-specific investor lending programs.
- Boulder CPA: For depreciation optimization on high-value properties and Boulder County property tax assessment appeal strategies. A $975,000 Boulder property generates substantial depreciation benefit that significantly improves the economics of negative carry.
Boulder-Specific Due Diligence
Physical Checks
- Hail damage assessment on all exterior surfaces
- Radon test mandatory in Boulder County elevated zone
- Flood zone confirmation for any property near Boulder Creek or Fourmile Canyon
- Wildfire risk assessment for properties near foothills (high risk zone)
- Sewer scope for pre-1985 properties
- Boulder Creek 2013 flood damage inspection for older east Boulder properties
Regulatory Checks
- Confirm existing Boulder rental license status and any outstanding violations
- Verify Group Living License eligibility for any student housing strategy
- Check any HOA rental restriction caps before condo purchase
- Confirm wildfire insurance availability for foothills properties
- Review current just cause eviction status with attorney
- Confirm STR license status if any STR strategy is contemplated
Competing in Boulder’s Market
Boulder is one of Colorado’s most competitive purchase markets. Strategies that work:
- Pre-inspections: In Boulder, conducting your inspection before submitting is standard practice. Properties on the Hill and in North Boulder regularly receive multiple offers within days. Pre-inspection allows clean non-contingent offers that win competitively priced listings.
- All-cash offers when possible: Boulder has a significant all-cash buyer pool from tech wealth and California equity transfer. If you have the capital, all-cash offers with quick closing timelines win routinely even at below-ask prices.
- Off-market relationships: Boulder’s market is tight enough that agent networks matter significantly. Agents with strong relationships in specific neighborhoods can access properties before MLS listing. This is the primary competitive advantage in Boulder’s sub-$1M market.
- Patient timing: Boulder has genuine seasonal patterns with the strongest inventory in spring (March through June) and the highest competition in that same window. Patient investors who can act quickly in July through September often find motivated sellers with less competition.
7. Financing Options for Boulder
| Loan Type | Down Payment | Rate Premium | Best For | Boulder Note |
|---|---|---|---|---|
| Jumbo Investment Loan | 25-30% | +0.75-1.25% | Most Boulder purchases above $806,500 | Standard for Boulder. Requires strong W-2 income, high credit score, and low DTI to qualify at Boulder’s price points. |
| Portfolio / Bank Statement Loan | 25-35% | +1.25-2.0% | Self-employed, high-net-worth investors with complex income | Private banks and wealth management lenders offer portfolio products for high-net-worth Boulder buyers |
| All-Cash | 100% | N/A | Investors with significant liquid capital | Common in Boulder. All-cash purchase with subsequent HELOC or cash-out refi after 6 to 12 months is a popular strategy to win competitive offers while eventually achieving leverage |
| DSCR Loan | 25-30% | +1.5-2.5% | Investors without traditional income documentation | Generally does NOT qualify for standard Boulder properties; cap rates of 3 to 4% cannot achieve 1.0x DSCR at current rates. Hill student housing using per-room income may be an exception. |
| East Boulder Conforming | 25% | +0.5-0.75% | East Boulder condos and Gunbarrel properties under $806,500 | Some east Boulder condos qualify for conventional conforming; the only Boulder submarket where standard investment loan terms typically apply |
| Private Wealth Lending | 20-30% | Negotiated | Ultra-premium Mapleton Hill and Chautauqua properties above $2M | Major private banks (JP Morgan Private Bank, Goldman Sachs) offer tailored financing for ultra-high-net-worth clients at Boulder’s premium price points |
Boulder Financing Reality: Boulder is one of the most challenging markets in Colorado to finance as an investment property. Most properties require jumbo loans, DSCR ratios that do not qualify at Boulder’s cap rates, and income levels that can service large negative carry alongside the mortgage. The investors who successfully own Boulder rental properties tend to be high-income W-2 earners (tech salaries, professional practices, or senior executives), successful business owners with substantial cash flow, or individuals who have transferred significant equity from California or other appreciated real estate markets. Boulder is not an accessible first investment market. It is a market for investors who have already built wealth elsewhere and are now seeking the most durable long-term store of value in the Mountain West.
8. Frequently Asked Questions

Knowledge Quiz: Boulder Colorado Real Estate
Open Quiz
5 quick questions on what you just learned about Boulder investing
1) Why does the guide say Boulder’s supply constraint is permanent rather than a temporary policy preference?
Answer: B
Boulder’s supply constraint combines geographic permanence (the Rocky Mountains cannot be developed regardless of policy), public land ownership (45,000+ acres of Open Space permanently in city hands), and the Blue Line policy limiting development above 5,750 feet. These constraints compound to make Boulder essentially unable to grow its housing supply at market pace, creating a structural appreciation driver that no policy change could quickly reverse.
2) What is the correct investment frame for evaluating Boulder real estate, according to the guide?
Answer: D
The guide is explicit that Boulder is not a cash flow market. Investors who evaluate Boulder using cap rates or DSCR will never buy and will miss one of the most consistent long-term appreciation markets in the American West. The correct frame is total return: the equity gain from appreciation plus principal paydown compared against the total carrying costs over the holding period. The guide’s 10-year comparison shows that even with $166,680 in cumulative negative carry on an East Boulder condo, the investor generates 3.1x return on total invested capital.
3) How does The Hill student housing compare to Fort Collins CSU student housing in terms of per-room rents?
Answer: C
CU Boulder’s Hill neighborhood generates per-room rents of $1,000 to $1,500/bedroom, 25 to 40% above Fort Collins CSU-adjacent properties at $750 to $900/bedroom. This premium reflects CU Boulder’s national draw and more affluent student family base. CU’s out-of-state and international students, who pay higher tuition and typically come from higher-income families, can support rents that are genuinely higher than the Colorado student average.
4) Why does the guide recommend Louisville as a strong alternative to Boulder city for investors?
Answer: A
Louisville at $680,000 median sits 30% below Boulder’s $975,000. It features Old Town character, RTD transit access to Boulder, Boulder County growth management policies, and proximity to the same tech employment base. Cash flow is negative $300 to $600/month versus Boulder’s $1,500 to $5,000 negative carry. No Boulder city regulatory overlays apply. Appreciation tracks at approximately 70 to 85% of Boulder city over long periods. For investors with $145,000 to $175,000 in liquid capital, Louisville is the intelligent Boulder County entry.
5) What makes the Marshall Fire relevant to Boulder County investors in 2026?
Answer: B
The December 2021 Marshall Fire destroyed approximately 1,000 homes in Superior and Louisville, creating an acute housing shortage that has kept Boulder County vacancy low and rents elevated through 2025. Superior is actively rebuilding, creating new construction investment opportunities at post-fire discounted prices reflecting lingering stigma. However, wildfire insurance in Boulder County has become significantly more expensive and harder to obtain, and investors must confirm coverage availability and cost before closing on any Boulder County property in fire-risk zones.
Work With a Local Expert in Boulder
We are building a verified network of real estate professionals across every market we cover.

About Our Expert Network
Boulder specialists in our network bring specific expertise in the city’s unique regulatory environment, supply constraint investment thesis, and the premium property segment that dominates the Boulder market. Boulder requires investors and advisors who understand total return analysis and can work comfortably in the $800,000 to $3,000,000+ range.
- Expertise in Boulder rental licensing, Group Living permits, and Boulder-specific tenant protections
- North Boulder Google corridor investment analysis and CU Hill student housing strategy
- Jumbo financing relationships and high-net-worth investment structuring
- Boulder County alternative market evaluation including Louisville, Superior, and Longmont
- Full transaction support from supply-constraint thesis evaluation through closing
Get Connected or Join Our Network
Looking for a Boulder expert? Contact us and we will connect you with the right professional.
Contact us at support@buildsandbuys.com
Find Specialized Boulder Real Estate Professionals
Ready to Invest in Boulder?
Boulder is not for every investor. The entry costs are the highest of any Colorado city, the cash flow is deeply negative, and the regulatory environment is among the most complex in the state. But for investors who can meet Boulder’s capital requirements and commit to the long-term appreciation thesis, the city offers something genuinely rare: a market that is permanently incapable of being oversupplied. The Flatirons do not negotiate. The Open Space does not develop. The mountains do not move. Every year that passes with more people wanting to live in Boulder than Boulder can house is another year of structural appreciation pressure on a finite housing stock. That asymmetry, permanent supply constraint against growing demand, is the foundation of one of the most consistent long-term wealth-building opportunities in the Mountain West.
Continue Your Research
Colorado State Guide
See how Boulder compares to Denver, Fort Collins, and Colorado’s full range of investment markets.
Fort Collins Guide
Compare Boulder’s premium thesis to Fort Collins’ more accessible university market with better cash flow.
144-Lesson Course
University-level real estate education covering total return analysis, appreciation thesis investing, and financing strategy.
For further guidance, explore our State-by-State Investor guides, browse our expert articles, or follow our Step-by-Step Investment Guide.